Stocks’ Roller-Coaster Week Has Negative Short-Term Implications
Last week, the S&P 500 registered a rare display of volatility. The week contained both the largest 2 up days in the past month and the largest 2 down days. This was just the 54th time since 1950 that the 2 largest up and down days in the past month occurred in a 5-day span. A few of those instances were clustered together so the unique occurrences were actually fewer. In terms of a calendar week, it was just the 13th such occurrence in 64 years.
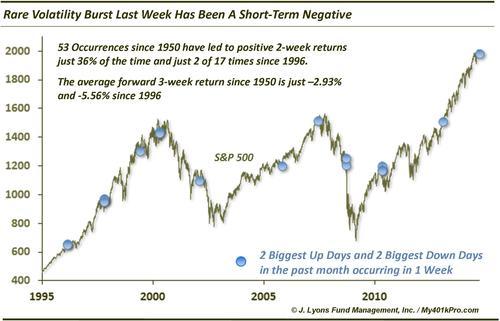
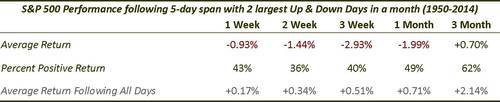
So what does this unique burst of volatility portend for the stock market? Historically, returns have been weaker than normal going forward, particularly in the short-term. The average 3-week return following these 5-day spans since 1950 has been a dismal -2.93%. More than half of all occurrences led to a negative 1-month forward return.
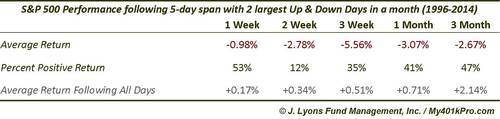
There were zero occurrences of this phenomenon between 1988 and 1995. Since 1996, there have been 17 (displayed in the chart). Results following these 17 have been especially poor in the near-term. After 2 weeks, only 2 of the 17 occurrences showed a positive return and the 3-week average return is a putrid -5.56%.
The average returns are skewed a bit by the Fall 2008 sell off which was forewarned by one of these volatility bursts in mid-September. However, the returns are also arguably understated as many of these bursts immediately preceded serious but short-lived sell offs such as October 1997 and May 2010. Thus the statistics on drawdowns following these occurrences are perhaps even more striking than the return data. For example, the average 1-month and 3-month drawdowns following all occurrences since 1950 is -5.48% and -7.01%, respectively. This compares with average drawdowns of -2.48% and -4.43% for 1 and 3 months following all days. Since 1996, 1-month and 3-month drawdowns have averaged -7.65% and -10.37% following the 5-day volatility bursts.
Lastly, while it is probably a stretch to make such a link, we don’t want to fail to mention the fact that a few of these occurrences happened almost immediately prior to some major cyclical tops, including February 1966, December 1972, April 2000 and June 2007.
We don’t want to make too much of any potential longer-term implications of these 5-day spans containing the 2 biggest up and down days of the past month (though, we certainly have our share of other concerns and this would fit in). However, this volatility burst has been fairly consistent as a harbinger of not only increased volatility overall, but increased volatility to the downside. So, although nothing has been able to break this almost 2-year run up in the S&P 500, this not portend good things for the index in the short-term.
________
More from Dana Lyons, JLFMI and My401kPro.

