Record spike in Inverse ETF Volume one sign of a bottom
Over the past 2 years, one of our favorite indicators of stock market sentiment has been the volume in inverse ETF’s. As we have discussed several times, we like to look at the relative ratio of volume in inverse ETF’s (funds that go up when the market goes down and vice-versa) to the total volume on the NYSE and Nasdaq. This indicator can give us an idea of how complacent (when the ratio is low) or fearful (when the ratio is high) traders are on a real money, real time basis.
One word of caution is that, due to the relative newness of the ETF’s, we do not have a lot of history on them or, by extension, the relative volume indicator. Therefore, we cannot be totally confident in how the indicator will behave, nor the levels that should be considered significant.
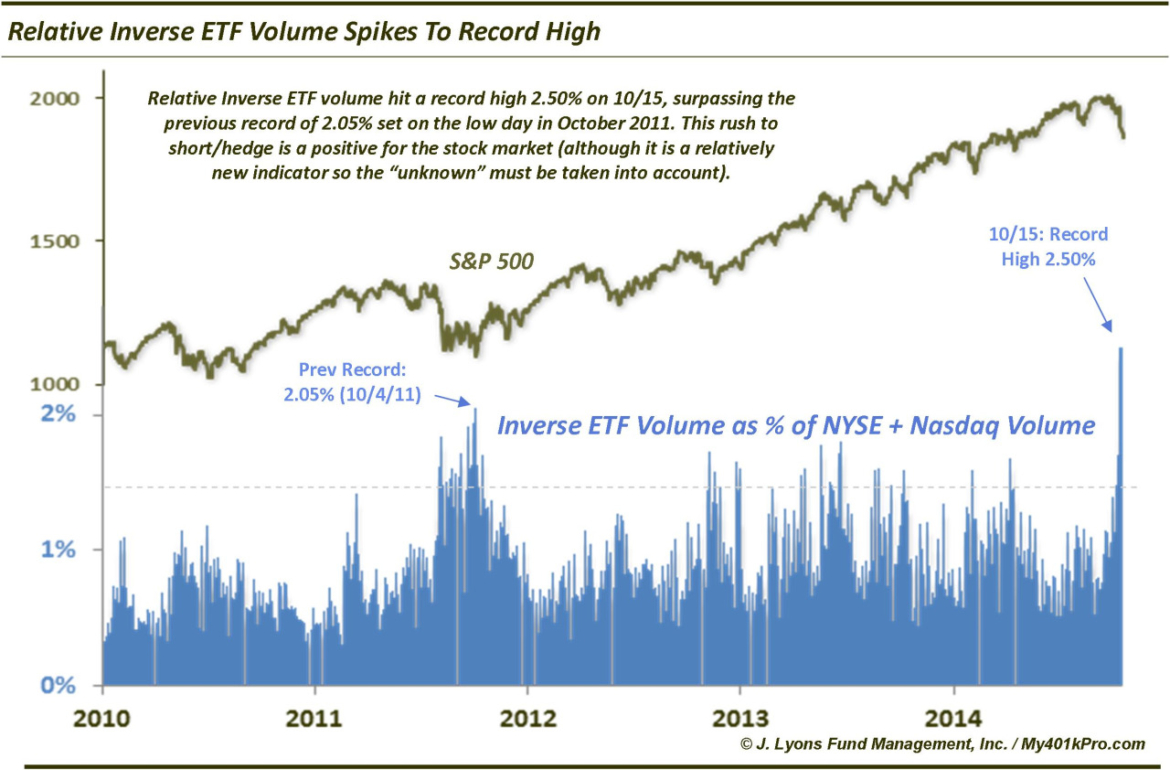
That said, we do have roughly 5 years of solid data and volume in these issues. Therefore, they can be, and have been, of vaue. Over the past few years, whenever relative inverse ETF volume has risen above roughly 1.5% of exchange volume, the stock market has tended to put in a short-term low either immediately or within days. On Wednesday, the ratio hit an all-time record of 2.5%. Now, the current decline is obviously a more serious event than any of the previous declines since the fall of 2012. Therefore, we would expect that relative inverse ETF volume might exceed recent spike levels. However, exceeding the 1.5% level by such a wide margin is certainly compelling evidence for it satisfying a bottom to the recent decline – at least, part of a bottoming process.
The previous record high in relative inverse ETF volume came on October 4, 2011 – the exact low date of the worst correction in the past 5 years. That high was 2.05%. So based on a comparison with the previous record, the recent reading again appears more than sufficient to satisfy an end or ending to the decline.
We say “ending” because, considering the nature of the current decline, we have strong suspicions that a bottom to it will unfold in a more traditional manner than the plethora of V-bottoms over the past two years. This decline has been more serious and we suspect that a V-bottom and subsequent moonshot back to the highs is not in the cards. A bottom here will quite likely include some kind of a retest of this week’s low before it is off to the races again. Therefore, this may just be the initial spike in inverse ETF volume. In the 2011 sell off, we saw inverse ETF volume spike initially in August during the first wave of selling. After chopping around for awhile, inverse volume spiked again, coincident with the final October low.
So this week’s lows may need to be tested as part of a bottoming process, and we may see another spike in inverse ETF volume during a retest. However, this week’s record spike in inverse ETF volume is a positive sign that traders have become too fearful, thus opening up the market to a bounce.
________
More from Dana Lyons, JLFMI and My401kPro.


