European stocks *should* bounce here
On August 13, we mentioned that European stocks, as represented by the MSCI Europe Index, had bottomed a couple days prior at precisely the right spot. By right spot, we mean as suggested by Fibonacci Retracement levels (see that post for a little more info on Fibonacci numbers). These key Fibonacci levels, indicated at the 1680 level, were derived from prior lows in June 2012 and June 2013. Sure enough, the Index bounced on August 8 at precisely 1680.
As we mentioned in the post, European stocks had been deteriorating for several months already, threatening the durability of the post-2012 uptrend. Thus any bounce off that 1680 level would likely be shorter-term in nature, “weeks to months” as we put it. Indeed the MSCI Europe Index was able to bounce for exactly 4 weeks before resuming its weakness.
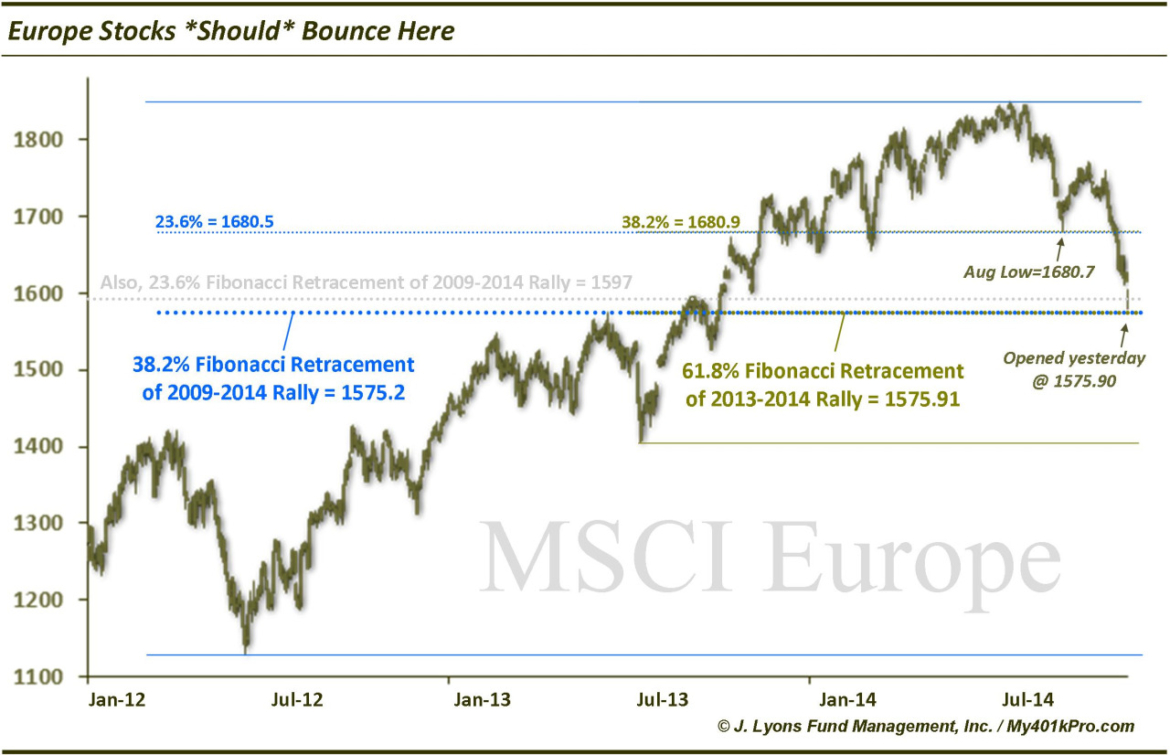
It has now reached the next Fibonacci “cluster” of key Fibonacci Retracement support around 1575, as signified by the following:
- 38.2% Fibonacci Retracement of 2012-2014 Rally ~1575.20
- 61.8% Fibonacci Retracement of 2013-2014 Rally ~1575.91
The MSCI Europe Index opened yesterday at 1575.90 and was able to close slightly above that level. With many global equity markets mired in quasi-waterfall type selloffs currently, the risk is greater right now that indexes will “overshoot” potential support levels. That said, the MSCI Europe Index, along with many of the individual nation markets on the continent, have already been beaten down mercilessly. Perhaps it has done its overshooting and is due for a bounce. If so, it is certainly at the “right” spot for it.
Then again, in an environment in which many indexes and stocks are being sold off beyond where they “should” bounce, there is always short-term washout risk.
________
More from Dana Lyons, JLFMI and My401kPro.