Low volume in Nasdaq bounce a red flag
We seldom consider volume metrics when analyzing the stock market. Frankly, we have found little evidence that the level of volume has a meaningful impact on the market’s prospects, at least on an intermediate-term basis which is our focus. However, we are always open to evidence pointing to the contrary. The recent bounce in stocks may contain such evidence.
While the historical sample size is small, the relatively low volume during the Nasdaq 100 rally the past few days may be a red flag. Specifically, the NDX rallied at least 1% on each of the past 3 days; however, it did so on less than 3-week average volume on each of the days. Historically, these events, shown on the chart, have led to consistently poor returns in the short-term.
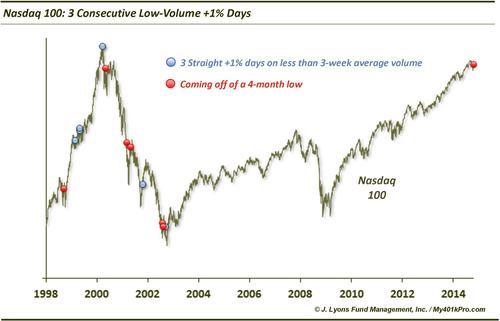
Similar 3-day stretches have occurred 12 times since 1995 in the Nasdaq 100. The significance is hard to see on the chart, so here are the dates and forward returns.
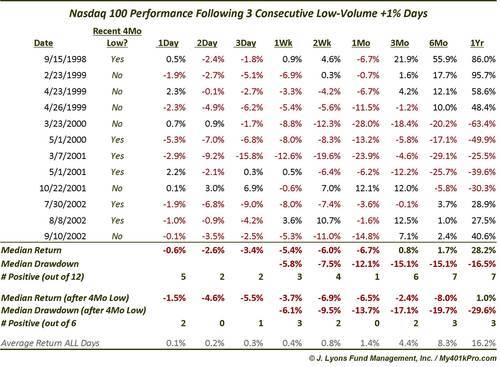
As the table shows, weakness transpired immediately and almost unanimously following these occurrences. After 2 days, 10 of the 12 occurrences showed negative returns, at a median of -2.6%. After 1 week, the median return was -5.8% and by a month later, the median return was -6.7%. After a month, returns tended to level out and the bulk of the drawdowns had taken place. The median return after 3 months was 0.8%, indicating an approximate median 7% rally from the end of month 1 to the end of month 3.
These statistical trends are indicative of a “retest”. That is, prices returning to “test” the low that was made before the bounce that included the 3-day rally. At a minimum, it is suggestive of a traditional bottoming “process” wherein prices chop around temporarily before taking off. That is opposed to the bottom “point” associated with the V-bottoms that have been the norm the past 2 years wherein prices immediately rebound and run unabated to new highs.
Speaking of bottoms, we also identified those occurrences among the 12 that closely followed a 4-month low, similar to our current situation. There were 6 such instances and returns going forward were actually slightly worse than among all 12. While 2 of these 6 saw gains on the first day (in September 1998 and May 2001), all 6 were lower by the 2nd day. After 3 of the them rallied to close higher 1 week later, by 1 month, they were all lower. Considering these occurrences came during somewhat similar circumstances as the present, we would consider this a red flag.
Interestingly, even those occasions that didn’t follow lows showed weakness in the short-term, including during the raging Nasdaq bull in 1999 and 2000. Also interesting is that the 3/23/2000 date happened to be the very day before the Nasdaq bubble popped.
To summarize, while we don’t normally focus too much on volume, in this instance, the low-volume 3-day rally in the Nasdaq 100 is somewhat of a concern from a historical perspective. There have not been many such 3-day moves in the NDX since 1995, but those few have shown consistently weak returns from 1 day to 1 month. This is particularly true when following soon after a 4-month low. This historical tendency would fit with other data we’ve looked at recently that has led us to favor the retest scenario rather than another V-bottom following last month’s decline.
Although, the stock market has done little yet in terms of price movement to suggest the V-bottom is out of fashion so that possibility cannot be dismissed.
________
More from Dana Lyons, JLFMI and My401kPro.


