Nasdaq Divergence Suggests More Weakness But Bottom Near
Yes, yet another divergence post. We’re trying to stay away from them but some developments are just too noteworthy to ignore. Yesterday, we looked at a longer-term divergence, on a quarterly basis. Today, we touch on the other end of the duration spectrum, looking at a daily breadth divergence that occurred on Tuesday. For just the 9th time since 1990, the Nasdaq 100 closed higher on the day while only about 30% of Nasdaq issues closed higher on the day.
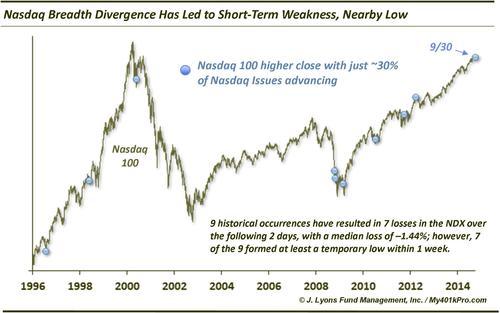
True, the NDX was up just 0.06%; however, with 70% of Nasdaq stocks declining on the day, it would be asking a lot for a sizable gain. In fact, 7 of the 9 previous occurrences saw the NDX up 0.41% or less. Nevertheless, to close higher on the day with 30% (30.6% to be exact) of issues closing higher is quite the feat.
So what is the significance of this divergence? Following the previous occurrences, we see that the Nasdaq 100 suffered consistent weakness in the very short-term, but also tended to form at least a temporary low in short order. Here are the results:
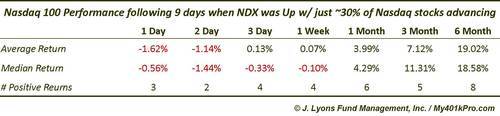
The worst average performance was the very next day, at -1.62%, almost dead-on yesterday’s NDX return of -1.61% (We wish we would have posted this yesterday, but we can’t always immediately publish posts on everything we want to. We chose the quarterly S&P 500-Russell 2000 chart instead as the previous quarter becomes ancient history after all the summaries on the 1st day of the new quarter.) On a median basis, the worst returns occur through 2 days (i.e., today) at -1.44%.
The good news is that from that point, things start to look up. Of the 9 historical occurrences, the NDX bottomed (at least temporarily) within 2 days 4 times. By the end of 1 week, 7 of the 9 had bottomed. The remaining 2 made a low by 2 weeks (those lows marked the March 2009 cyclical low and the October 2011 intermediate-term low.)
One other thing we will mention is that most of the previous instances happened after significant weakness had already occurred in the Nasdaq 100. This time, the index was only a little more than a percent off of its high. 2 of the other occurrences that were perhaps similar in this regard happened in May 1998 and March 2012. The 1998 instance saw the NDX drop for a week before bouncing strongly up to 2 months. In 2012, the NDX held up well for a couple weeks before dropping sharply to the 2-month mark. So no “tell” there.
The takeaway? The current weakness in the Nasdaq 100 is not unexpected. If this instance transpires per the historical norm, the NDX should see at least a short-term low within the next 10 days, at worst, and perhaps today, at best. Of course, as these things go, “IF” is always the key word.
________
More from Dana Lyons, JLFMI and My401kPro.


