Surprise! International Stocks are at a 52-Week Low

We have published quite a few posts covering international stock markets over the past several months. Most of these posts have been cast in a positive light (save for some focusing on Europe, particularly the PIIGS). There has been a particular focus on breakouts and potential breakouts. Over the past month, most international stock markets have been mired in a downdraft. In turn, the previous plethora of potentially positive charts have evolved into failed breakouts (e.g., Australia), pullbacks to breakout areas (e.g., Hong Kong) and breakouts that never materialized (e.g., U.K.). This downdraft has also quietly left arguably the most popular international stock index, the MSCI EAFE Index, at a 52-week low.
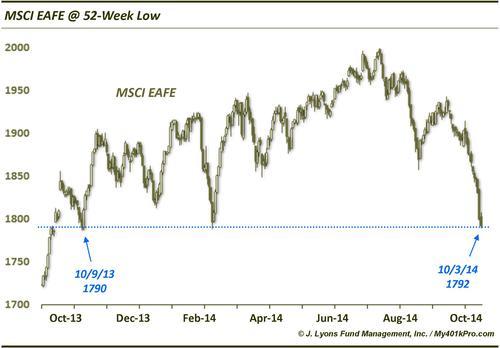
The EAFE (stands for Europe, Australia and Far East) closed on Friday at the lowest level, 1792, in almost exactly 1 year. This stealthy move caught many investors off-guard and has left the EAFE at a new year-to-date low, slightly undercutting the previous low from February. While a 52-week low doesn’t guarantee more losses are in store – indeed, on a short-term basis, it can indicate an oversold condition – it is never a welcomed sign. Especially concerning in this instance is the amount of technical damage done to this index during the selling of the past month.
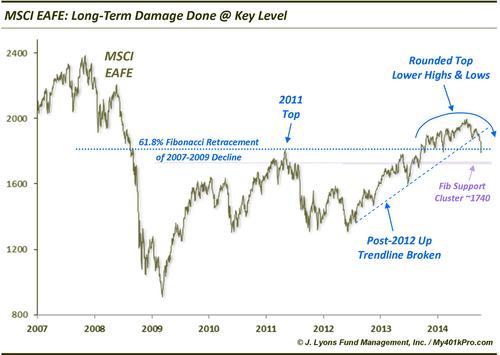
For one, the EAFE has now put in a lower high and lower low for the first time since the post-2012 bull market began. This is the definition of a down trend. While it does not mean a long-term downtrend has begun, the onus is now on the bulls to prove that one has not begun. Additionally, in the process, the EAFE has formed a rounded top pattern that suggests more downside lies ahead. It will take a higher high above the early September level around 1937 to negate this pattern.
Furthermore, in just the most recent selling, the EAFE broke down below the up trendline that has been in place since the 2012 bottom. This line was fairly developed, precisely connecting the July 2012, June 2013 and August 2014 lows. Once again this doesn’t mean a long-term downtrend must commence. However, the positive momentum of the past 2 years has been broken, at a minimum.
Perhaps the most major concern is that a key level around 1800 is now under siege. This level represented the 61.8% Fibonacci Retracement of the 2007-2009 decline. The level was first touched, and rejected, in May 2011. That resistance held for over 2 years before the EAFE was able to break above it about a year ago. If the index is to sustain its post-2009 bull market and make a run at another new high, holding this general area is, in our view, an important task.
Considering the technical damage done, we would not be surprised to see the current level broken, after perhaps a short-term bounce. The good news is that significant support lies around 1740, signifying Fibonacci Retracement support from the lows in 2009, 2012 and June 2013. The bad news is everything else that we mentioned above. Additionally, if the upward momentum in the U.S. finally succumbs to a similar halting, more pressure could be heaped upon the international markets.
At a minimum, a 52-week low in the MSCI EAFE is a concerning development for worldwide equity markets – especially when investors actually notice it.
________
“Surprise!!!” photo by Benson Kua.
More from Dana Lyons, JLFMI and My401kPro.