Some Vexing Behavior From The VIX

While the S&P 500 scored another all-time high on Monday, the market once again sent signals that it may not be a smooth ride ahead (see last Thursday’s “ugly” new high). Bear in mind, it is not our intent to discredit new 52-week highs or to nitpick every minor imperfection in the market. However, we are paid to assess the realities of the current market and identify the potential risks. And the reality is that while the major averages continue to make new highs, there are increasing indications that those potential risks are building.
The new warning signs we detected yesterday came from the behavior in the Volatility Index, or VIX. The VIX is a measure of volatility expectations derived from trading in S&P 500 options. Typically, the VIX falls as the market rises. Yesterday, however, the VIX jumped more than 5% even though the S&P 500 hit a new high. How odd is that? Since 1998, it has only happened 10 other times.
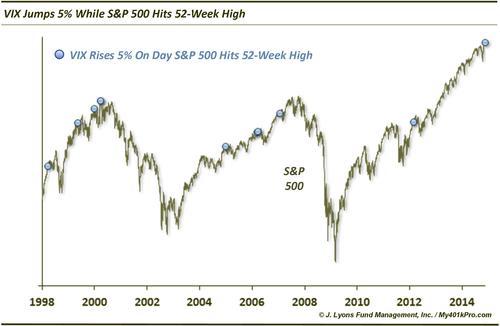
From a glance at the chart, it is readily apparent that many of these occurrences came near at least intermediate-term tops. Thus, as you might expect, S&P 500 returns following these signals were not very good.
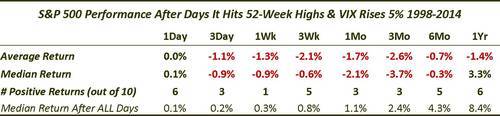
From the very short-term to the longer-term, returns were much worse than normal. In fact, returns were typically negative. Especially noteworthy, perhaps, are the short-term 1-week and intermediate-term 3-month timeframes. After 1 week, just one of the occurrences showed a positive return as the average return was -1.3%. 3 months out, the median return was -3.7%, with just 3 of the 10 showing positive performance.
Another angle to yesterday’s odd VIX action is the fact that it closed at an 8-day high, despite the 52-week high in the S&P 500. This has also been a rare occurrence. Since 1998, it has only happened 14 times prior.
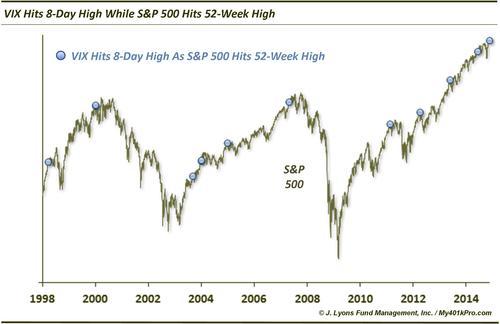
A few of the dates were the same as those in the first study above. Again, returns following these 8-day highs in the VIX were not particularly good.
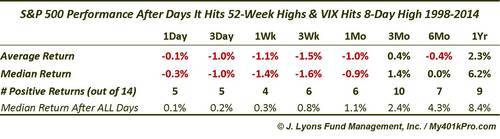
After these events, the S&P 500’s performance was especially poor in the short-term. The median return after 3 days was -1.0% and -1.4% after a week. 10 of the 14 occurrences showed a loss after a week. And while the longer-term returns were not as bad as in the first table, the median return after 6 months was still exactly 0%.
One slight caveat is that prior to 1998, returns following the two signals mentioned above were not quite as bad as those since 1998. Returns were still below normal in the intermediate-term. Plus, there were several timely warning signals given, such as at the high in August 1987 before the crash. However, thanks to several signals during the relentless rally in the mid-1990’s, returns were only slightly below normal.
It is possible that we are in a similar market as the mid-1990’s and indeed the relentless bid has certainly been a component of the past 2 years. However, even the VIX signals mentioned above that have triggered over the past 2 years have preceded short-term weakness. Therefore, at a minimum, some caution is warranted in the short-term. Additionally, if one is skeptical (we are) that the market can continue its relentless up move like it did in the mid-90’s, expectations over the intermediate-term should probably be dampened as well.
So while we are not complaining about an all-time high in the S&P 500, we would not be surprised by some turbulence up here.
____
“Water (Explored)” photo by johanlundahl.
Read more from Dana Lyons, JLFMI and My401kPro.

