Yesterday Was One of the Ugliest “Up” Days in History

At yesterday’s close the major averages, S&P 500, Dow Jones Industrial Average and Nasdaq Composite, were all in the green. However, despite the fact that the averages were “winners” on the day, there was plenty of ugliness below the surface. In fact, it was one of the ugliest “up” days that we can find in market history.
Why do we say this? Let’s look at the evidence.
1) Breadth on the NYSE + Nasdaq was among the worst ever on an up day in the S&P 500
Despite the S&P 500 closing up on the day, breadth was awful. In fact, the combined NYSE plus Nasdaq breadth showed one of the worst readings of any S&P 500 up day.
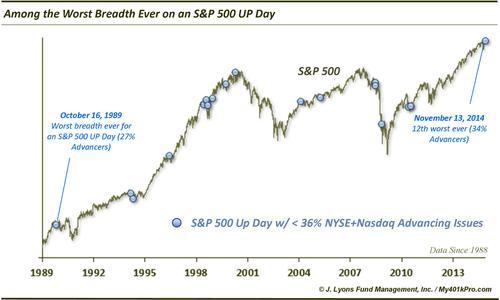
The combination of NYSE and Nasdaq Advancing Issues amounted to just 34% of all issues. That is the 12th worst showing of any S&P 500 up day since 1988 (the beginning of our Nasdaq breadth data.) To put that into perspective, there have been 3602 up days during that time. That puts yesterday’s breadth reading in 0.3 percentile of all up days. Or, 99.7% of up days had better breadth than yesterday.
2) Breadth on the Nasdaq was the 2nd worst ever for a 52-Week High in the Nasdaq Composite
Despite the Nasdaq closing at a 52-week high, the breadth on the exchange was awful. How bad? It was the 2nd worst ever for a Nasdaq new high.
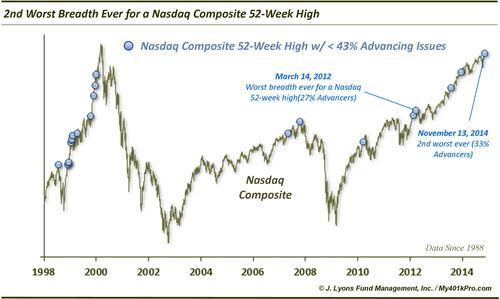
Just 33% of Nasdaq Issues closed higher on the day. Since 1988, only March 14, 2012 had worse breadth for a Nasdaq new high. Put another way, during that time, there have been 717 Nasdaq 52-week highs. Yesterday ranks 716th in breadth.
3) NYSE Breadth was the 3rd worst ever for a Dow Jones Industrial Average 52-Week High
Continuing the theme, NYSE breadth was terrible for a 52-week high in the Dow. In fact, going back to 1965, it was the 3rd worst ever on such a day.
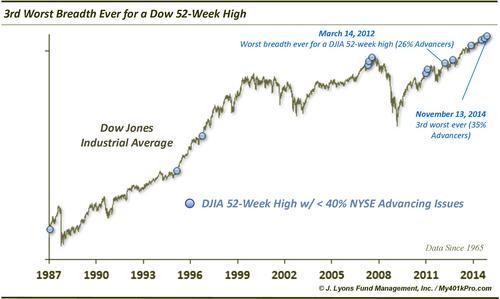
There have been 994 52-week highs made by the Dow since 1965. Only March 14, 2012 and July 16, 2007 had worse NYSE breadth than the 35% Advancing Issues yesterday.
4) Yesterday’s 0.93% loss in the Russell 2000 was the 4th worst ever on a day the Nasdaq 100 made a 52-Week High
Despite the new high in the Nasdaq 100, the Russell 2000 small cap index lagged significantly, better reflecting the poor breadth on the exchanges.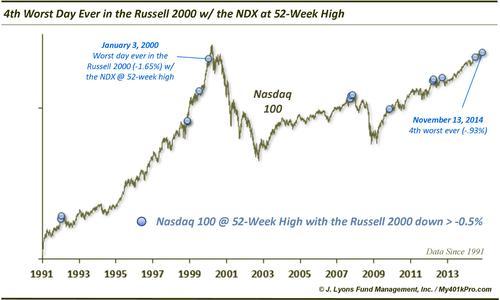
While the NDX was up almost .5%, the Russell 2000 lost nearly 1% on the day. This was the 4th worst showing by the Russell 2000 ever on a day that the Nasdaq 100 made a 52-week high. Only January 3, 2000 and March 14 and 20, 2012 saw the Russell 2000 perform worse.
5) The Dow closed at a 16-day high, but so did High Yield rates
While the major averages had the appearances of a “risk-on” day, not all risk assets cooperated. For example, High Yield Rates, as measured by the BofA ML US High Yield Master ll Effective Yield, also closed at a 16-day high.
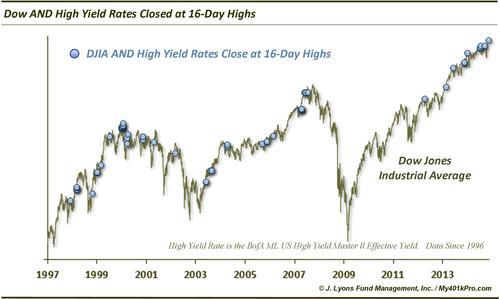
While High Yield rates reflect bond instruments and are somewhat subject to other interest rate movements, they often move more based on their credit risk components. That is, they often move along with equities, as the risk characteristics are arguably more closely aligned. However, high yield rates hit a 16-day high yesterday along with the Dow. Thus, high yield prices, which move inversely to rates, hit 16-day lows. This could be a warning sign, particularly if those who argue that the bond market leads the stock market are correct. There is certainly some historical evidence to back that up.
So what’s the big deal? As we have mentioned before, we are strong advocates of widespread participation as an indication of the health of a market rally. That is, the more stocks and sectors, etc. that are moving up, the better. Signs like we saw yesterday reveal the exact opposite, a superficial rally in the indices as the majority of stocks are weakening.
But, does one less-than-ideal day really make a difference? Probably not by itself. However, within the context of a very mature rally and longer-term divergences aplenty, even one day can be a red flag. The location of many of the blue markers on the charts above indicate that while these ugly up days are at times 1-hit wonders, they have often been harbingers of worse things to come on an intermediate or longer-term basis.
____
Read more from Dana Lyons, JLFMI and My401kPro.


