2014: The Most SKEWed Year On Record For Stocks

We’ve covered the CBOE SKEW in several posts during 2014, and for good reason. Its behavior this year has been unlike anything we’ve seen before, i.e., unprecedented…sound familiar? To reiterate, the SKEW is an Index calculated from S&P 500 out-of-the-money options that measures perceived tail risk, i.e., an outlier event two or more standard deviations below the mean. Essentially, it measures options traders’ perceived risk of a major decline (more at CBOE.com).
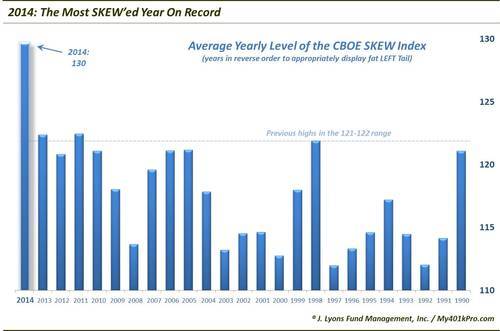
So what makes 2014 so unique in the SKEW’s behavior? Typically, the SKEW ranges from 100 to 150. Readings close to 100 indicate that the perceived probability of an outlier return is negligible whereas readings approaching 150 suggest the probability is significant. 2014 has seen an inordinate number of high readings above 130 and even 140. There have been so many, in fact, that the average SKEW level for the entire year is 130. For perspective, no other year since the SKEW was first published in 1990 has averaged more than 122.
A couple more stats for perspective:
Since 1990, there have been a total of 245 days on which the CBOE SKEW reached 130; 110 of those, or 45%, have come in 2014.
Since 1990, there have been just 11 days on which the CBOE SKEW reached 140; 7 of those have come in 2014.
So what is the takeaway from these skewed SKEW readings? Is it a major concern for the market? Well, like we have touched on over the past few days, there have been so many unprecedented developments this year that it is difficult to know what they mean. And if we do have an inkling about whether these things are bullish or bearish, it is even more difficult to know when their impact will be felt.
In this case, the message suggested by these high SKEW readings is obviously a negative one, if indeed they are accurately portraying the probability of an outlier, black swan-type of event. Historically, these high readings have had mixed results. The high readings in 1990, soon after the SKEW was launched, gave an early warning of the summer-fall market correction, coincident with Iraq’s invasion of Kuwait. This event led to the SKEW indicator’s popularity as a predictor of outliers.
In 1998, many of the elevated readings that produced the high average SKEW for the year came after the summer-fall correction, so it was not much help then. The SKEW also stayed low during the buildup to and duration of the 2000-2002 cyclical bear market. It did regularly score high readings from mid-2005 to early 2007 in the lead-up to the 2007-2009 bear market, though the warnings were obviously early.
More recently, the SKEW has been higher than its historical average really since 2010. A few sporadic high readings preceded the sizable declines in 2010, 2011 and early 2012. However, since the end of 2013, the SKEW has been consistently elevated, without any trace of tail risk. The only risk the past few years has been in missing out on the multitude of V-Bottoms.
So why the elevated readings? Perhaps it is a by-product of the persistent low-rate, low-volatility environment of the last few years that allows for cheaper protection in the way of out-of-the-money puts. Even then, for the SKEW to average 130 – more than 8 points higher than any other year – seems rather, uh, skewed.
This is another one of those unprecedented developments that will likely need to go into the “wait-and-see” category as to its ultimate meaning or impact on the market. However, we have a suspicion that when all is said and doen, we may look back at this chart as one of the most significant of the year.
Have A Merry Christmas!
________
More from Dana Lyons, JLFMI and My401kPro.


