This Signal Has Perfect Record Of Forecasting Year-End Gains
In pursuit of every edge that we can find, we do a lot of research into short-term market patterns and tendencies. The truth is, however, that the vast majority of our investment strategy is guided by longer-term, “slow money” tactics. These tactics, which we have quantitatively modeled, are more consistent and robust than these pattern studies, not to mention, lower maintenance (the model work has already been done over the course of many years). However, once in awhile, we uncover a pattern whose results have been so overwhelmingly consistent that it is hard to ignore. Such is the case with today’s Chart Of The Day.
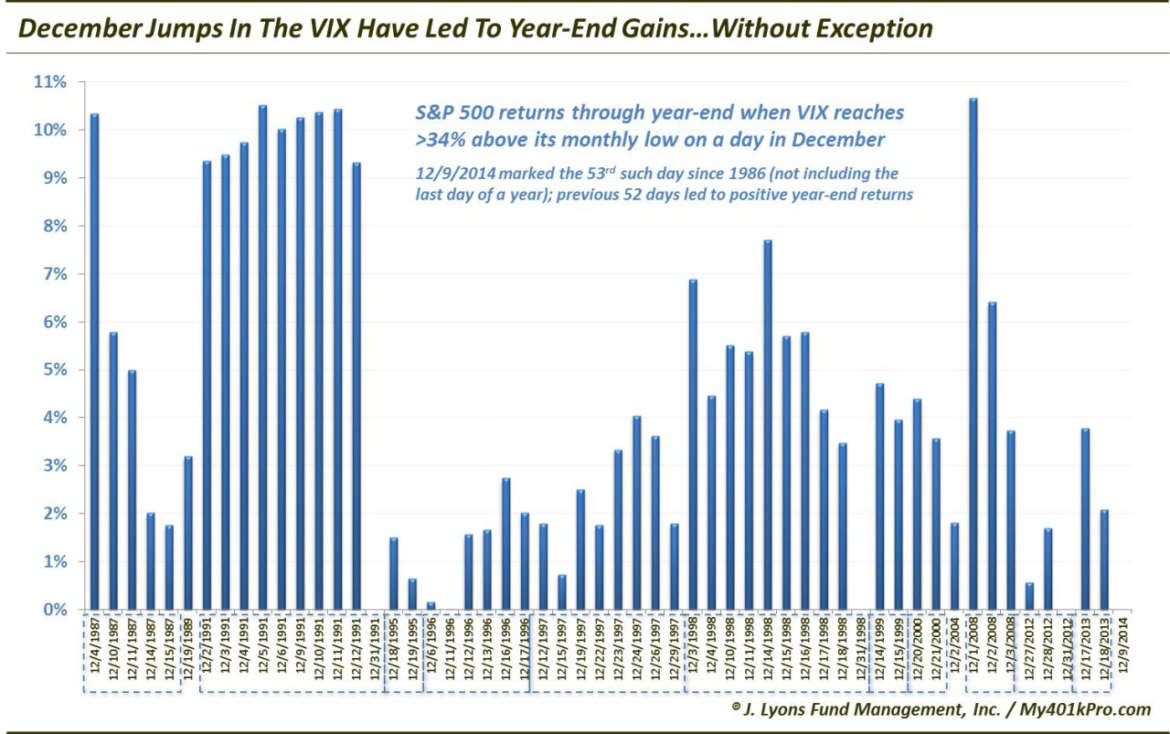
Since its inception in 1986, the S&P 500 Volatility Index (VIX) has traded more than 34% above it 1-month low on 52 separate days in December. From the close of each day through the end of the year, the S&P 500 has been positive following all 52 days (this obviously excludes occasions that occurred on the final day of a year).
At the high of the day yesterday (December 9), the VIX was 41% above its 1-month low, set on Friday. Therefore, if the historical pattern is to hold true again, the S&P 500 should close the year above yesterday’s close of 2059.82.
The median gain following these days until year-end has been nearly 4%, which would put the S&P 500 at around 2140 on December 31. However, the historical gains have not all been sizable. For example, after triggering this signal on December 11, 1996, the S&P 500 closed the year just 2 pennies higher than its close on that day.
Additionally, several years had multiple days meeting the criteria of the study. 1991 had the most days with 10. It also closed the year extremely strong with year-end returns of close to 10% for most of those days. So the median returns are somewhat skewed by a few years with multiple occurrences that happened to close the year extremely strong.
Nevertheless, the sample includes instances from 13 prior years. So while the magnitude of the year-end gains may be skewed a bit by a few years, there is no skew to the consistency of the signal. 52 out of 52 is a track record we will take any day.
Of course, despite the perfect record, hopefully it goes without saying that there is no guarantee. There is always a first time for everything. However, while it may seem like everyone on Wall Street and Main Street is expecting a year-end rally, it would appear that they do have some evidence backing them up.
__________
More from Dana Lyons, JLFMI and My401kPro.

