Chinese Stocks Make Their “Big Move”
Our Chart Of The Day on June 20 revealed how China’s Shanghai Composite was trading in its tightest range in 13 years.
June 20 Chart Of The Day:
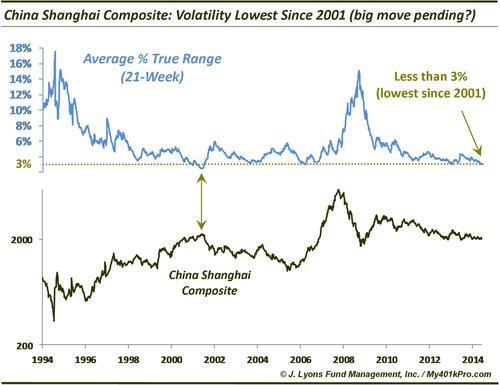
In the accompanying June 20 post, we mentioned that “low volatility extremes typically lead to explosions in volatility.” Because of that we stated “it would not be surprising” to see a “big move” soon. And a big move we got.
While we couldn’t have predicted that June 20 would be the absolute low price for the index for the next 6 months, it wasn’t a shock that volatility picked up almost immediately. The magnitude of the move, however, has been an eye-opener. After today’s 4%+ move, the Shanghai Composite is up over 40% since the June 20 post.
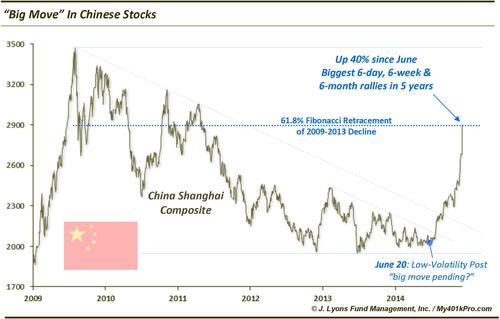
To say that Chinese stocks are on a tear would be an understatement. The post-June rally gathered steam after breaking key down trendlines in July and October. More recently, the up-move accelerated further following the opening of the Shanghai market to foreign investment. At the moment, the Composite is showing its largest 6-day, 6-week and 6-month gains in roughly 5 years.
So has the rally run its course or could there be more to this move? In our view, there likely should be more to go…maybe a lot more. When a market breaks out of a low-volatility compression like the Shanghai Composite has recently, it typically moves to a high-volatility extreme, eventually. In that regard, this move may just be getting started. Furthermore, the momentum behind the current move is not something that is easily and quickly negated.
Additionally, the index has been declining for essentially 5 years straight since the middle of 2009 – or 7 years, excluding the 9 month rally from 2008 to 2009. From that perspective, Chinese stocks are “due”. And while “due” is not a catalyst, since markets move in cycles, due is not an irrelevant concept either. Therefore, considering the “years-long” decline, the market certainly could be in store for a “years-long” rally.
That said, there are a few flies in the ointment at the moment. One is that after a 40% rally in 6 months, and a 26% rally in 6 weeks, the market is obviously overbought on several durations. While that may not be a catalyst to sell or short the market, it certainly could use a bit of a breather before resumption of the up-move. Indeed, the last time the market jumped over 25% in 6 weeks (2009), it dropped almost 20% over the next few weeks before rallying again to new highs.
Perhaps more significant is its proximity to a major line of potential resistance. Specifically, the 61.8% Fibonacci Retracement of the 2009-2013 decline comes in precisely where the index closed today. Therefore, we wouldn’t be surprised to see some consolidation near here, even if temporary.
However, to reiterate, when markets break out of an extreme range compression, it usually results in a big move. To our non-surprise, that is what we are witnessing in the Shanghai Composite. Before it’s all said and done, it may be a really big move.
________
“Shanghai Tower” photo by Lawrence Wang.
More from Dana Lyons, JLFMI and My401kPro.