Record Volume Skew To Down Side In 2014

As we wrap up another year in the markets, we are taking stock (no pun intended) of some of the trends evident throughout 2014. We noted on Wednesday that the CBOE SKEW Index showed by far the highest average reading of any year on record. Another indicator also happened to show the largest skew ever: the amount of volume during DOWN Days versus volume on UP Days on the Nasdaq. In other words, the average volume on the Nasdaq during DOWN Days during 2014 exceeded the average volume during UP Days by a record amount going back to 1972.
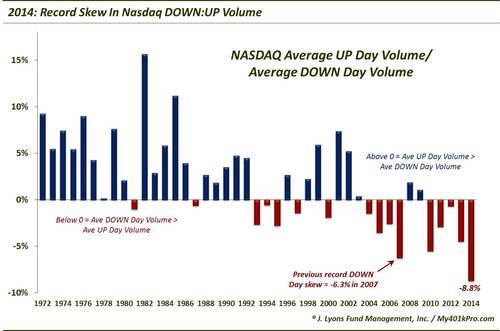
During the year, the volume on the Nasdaq exchange was almost 9% greater during DOWN Days than it was on UP Days. Somewhat ominously sounding, this surpassed the previous record set in 2007 of a 6.3% skew on DOWN Days. However, before one gets too alarmed regarding the implications of this, let’s look at the historical record.
Since 1972, when average Nasdaq volume on DOWN Days exceeded the average on UP Days, the Nasdaq Composite averaged a gain of +11% following year.
Since 1972, when average Nasdaq volume on UP Days exceeded the average on DOWN Days, the Nasdaq Composite averaged a gain of +13% following year.
So despite the fact that 2007 was followed by a horrendous year in the Nasdaq, historically, the UP/DOWN Day volume skew made little difference going forward. For example, just last year, the Nasdaq saw an average of 4.5% more volume on DOWN Days than UP Days. That certainly did not stop the Nasdaq from having a solid year this year.
So what is going on? Well, from a glance at the chart, it is apparent that there has been a general trend toward heavier average volume on DOWN Days than UP Days over the past 30 years. Additionally, we’ve mentioned before that there have been far fewer DOWN Days than UP Days in recent years, including 2014. This year, for example, there have been 139 UP Days versus just 105 DOWN Days on the Nasdaq.
We’ve likened it before to a commuter train making many stops to pick up passengers, but only letting them off at the final stop. Obviously, there will be many more people exiting at the one stop than getting on at any one of the earlier stops. That’s how it’s been this year, particularly with the low-volatility rallies and the quick sell offs that have resulted in semi-panic at their nadirs.
The bottom line? The fact that a record amount of volume occurred during DOWN Days versus UP Days in 2014 may be a trend of concern. However, looking historically, it does not appear to be the case. It is likely simply an indication of a more urgent rush for the exits on the relatively few DOWN Days as compared to UP Days during the year. So, we’ll chalk this one up to another trivial stock market record in 2014 rather than something to be concerned about.
________
Photo by Pyogenes Gruffer.
More from Dana Lyons, JLFMI and My401kPro.


