The VIX Is Going The Wrong Way

Whenever I hear the words “you’re going the wrong way”, I immediately think of the classic scene from Trains, Planes & Automobiles when Steve Martin and John Candy are driving in inclement weather down the wrong side of the highway. When the driver in the car across the median tells them “you’re going the wrong way!”, John Candy shrugs him off saying, “how would he know where we’re going?” In a less amusing example, the S&P 500 Volatility Index (VIX) has been going the wrong way for months now, even when stocks were hitting new highs.
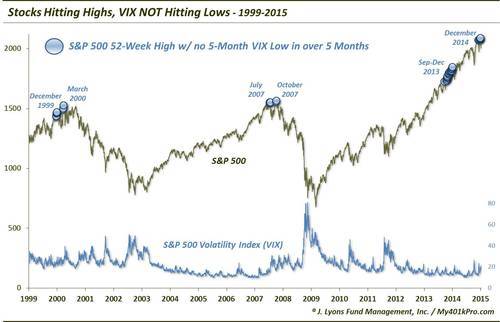
Typically, we see the VIX move lower as stocks rise. Up-trending markets tend to be less volatile and breed more complacency than declining markets. That’s why we found the recent situation in the market to be so unusual. The S&P 500 was hitting new 52-week highs as recently as late December while the VIX bottomed way back in the beginning of July. We looked back to see if there were other occasions in which the S&P 500 was at a 52-week high, yet the VIX had failed to even make a 5-month low in at least 5 months.
Based on the timing of some historical precedents, this may be of concern for stock bulls.
Prior to the 6 December occurrences, there were a total of 35 other days since 1999 on which these conditions existed:
- 6 days from December 21-31, 1999 The S&P 500 failed to make a new high after December 31 until March 21, 2000 which brings us to…
- 4 days from March 21-24, 2000 The S&P 500 failed to surpass the March 24 high over the next 7 years.
- 3 days from July 12-19, 2007 The S&P 500 failed to make a new high after July 19 until October 5, 2007 which brings us to…
- October 5 and 9, 2007 he S&P 500 failed to surpass the October 9 high over the next 5.5 years.
- 20 days from September 18 to December 31, 2013 While the market had brief selloffs after the September 18 and December 31 instances, the S&P 500 has generally continued its uptrend unabated.
You can see where the concern comes in when looking at some of the inauspicious dates of prior occurrences. And certainly this is not the sole similarity between present market conditions and those at the 2000 and 2007 tops. That said, there are some legitimate caveats.
First off, the sample size is not huge so it is difficult to place too much blind confidence in the signal’s warning – although, that is sort of the point: this is a highly unusual condition. It seems that all too often, critics use the “small sample size” argument when considering similar statistics. The study may not guarantee similar results as in the past, but it does not disqualify the condition as unhealthy.
A more legitimate caveat is the presence of the condition in late 2013 that did not produce much more than a hiccup for the market. Furthermore, from 1987 to 1998, the condition was triggered on a total of 83 days, 75 of which occurred in the mid-late 1990’s. While there were instances, specifically June 1987 and October 1997, that preceded market corrections, by and large, the S&P 500 continued to rally over that period.
This might be another strange circumstance of the present market environment whose impact we won’t realize for some time. It certainly seems to depend on the overall market climate. If we are in a mid-late 1990’s type market, it is conceivable that stocks can continue to power up right through these types of concerns. However, if we are closer to a 2000 or 2007 type of a market, i.e., an aging bull whose days are numbered, this atypical behavior on the part of the VIX may be shouting a warning at us. If that’s the case, it may be the S&P 500 that is going the wrong way.
________
Photo from Paramount Pictures’ “Planes, Trains & Automobiles”.
More from Dana Lyons, JLFMI and My401kPro.


