Why Is VIX Volatility At Crisis Levels?

In this era of financial engineering, we have new ways of measuring all matters of behavior in the markets. We have derivatives and 2nd derivatives and 2nd derivatives on derivatives (sometimes, it’s difficult to remember what an indicator is actually measuring.) By now, most people are familiar with volatility indexes, e.g., the VIX which measures expected volatility on the S&P 500. Now, there is even a volatility index for the S&P 500 Volatility Index. The VVIX, according to its publisher, the CBOE, “is an indicator of the expected volatility of the 30-day forward price of the VIX”. Lately, the VVIX has been exhibiting some interesting behavior.
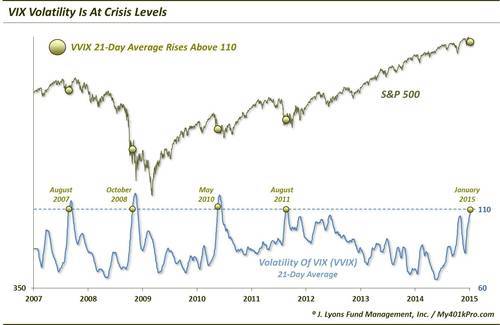
Typically (i.e., 90% of the time), the VVIX ranges between 60-100. In the past few days, the 21-day average (approximately 1 month) of the VVIX reached a level of 110. Since the inception of the VVIX in 2007, this is just the 5th time its 21-day moving average has gotten that high. The other 4 occurred during times of legitimate – or pending – market turmoil.
Here are the dates of the prior occurrences, as shown on the charts:
- August 2007: sell off preceded cyclical top
- October 2008: financial crisis
- May 2010: flash-crash
- August 2011: debt ceiling/downgrade crisis
So what’s with the current reading? Well, what do you need for VIX volatility? – ups and downs, of course, but especially ups. How do you get “ups” in the VIX? – by the market going down. Outside of the regular, but moderate, V-bottoms recently, the equity market has been especially benign. At least as compared with the prior VVIX spikes.
During the prior 4 spikes in the 21-day average VVIX, the market had sold off over the prior month by 10%, 30%, 12% and 17%. At the low close of the recent sell off on Wednesday, the market was down a whole 4%. In December when the VVIX (not the 21-day average) hit a recent high of 138, the S&P 500 was down less than 5% at its low-point. That’s quite a reaction for such a small sell off. Of the 233 days since 2007 in which the S&P 500 showed a 1-month loss of 5%, the VVIX averaged just 98.
It is possible that the now-compressing cycle of V-bottoms is producing this “crisis-level” of VIX volatility. The V-bottoms are getting so frequent that now we getting V-tops (carot-tops?) as well in between the bottoms. Even still, at its recent highs, the VIX was an average of 50% lower than where it stood during the other VVIX spikes. So despite the V-cycle volatility recently, it is hardly comparable to the other “crisis” periods.
So what’s going on? We’re not totally sure but the VIX and VVIX seem to be detecting something that isn’t readily apparent in market prices. Perhaps, there is some sympathy with the soaring volatility indexes in commodities and currencies. Perhaps it is in anticipation of something pending, ala 2007. That was the only prior instance that bore any resemblance to our current circumstances in that the market was 4 years into a cyclical bull market and had only experienced a relatively moderate decline in August. If that is the case, then the market could be setting up for some trouble ahead.
Please note that we are not forecasting that outcome based on this reading. We simply don’t know what its implications are. Additionally, we are also aware that the prior high readings came after much of the market selling had been done, i.e., the market was near a bottom. That is not our forecast either as it cannot be reasonably argued that we are due to emerge from some crisis at this point, down some 2% from the highs.
Our unsatisfying conclusion is that this is another one for the “Hmmm” pile, but slightly leaning negative due to the 2007 similarities. Only time will tell.
____
“Water (Explored)” photo by johanlundahl.
Read more from Dana Lyons, JLFMI and My401kPro.


