2000 High In The Nasdaq 100 May Be A Ceiling As Well As A Target
All the hoopla in the financial media of late surrounds the approaching 2000 highs in the Nasdaq Composite. While this indeed would be a noteworthy milestone, the hype is getting a little much already. So hopefully the index can hurry up and get there so we can move on (related: see our post from yesterday on the Nasdaq’s recent record streak). Despite the broad Nasdaq Composite’s seemingly imminent achievement, the large cap Nasdaq 100 (NDX) is still roughly 8% away from its 2000 (intraday) high of 4816. So it’s still got some work to do.
Should the NDX reach its 2000 high, the chart suggests it may encounter at least some temporary resistance at that point. Besides the mere fact that it’s the former high, various Fibonacci levels are clustered there as well. You may have seen us mention Fibonacci Retracements quite often in our posts. These represent levels based on Fibonacci numbers where retracements, or countertrend moves, may find support or resistance. Fibonacci Extensions are levels based on Fibonacci that indicate potential key price levels should the former range be completely retraced and price continue in the other direction.
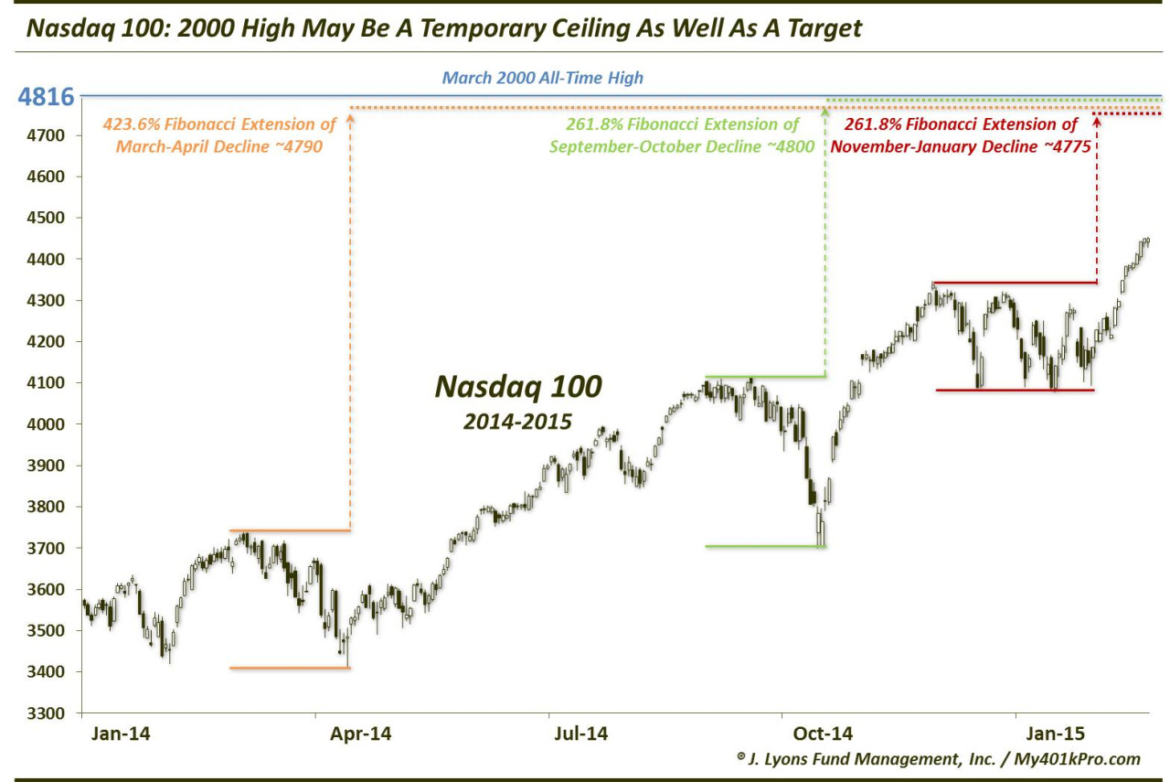
It turns out that key Fibonacci Extensions based on the last 3 pullbacks in the NDX all align near the 2000 high in the index around 4800. Specifically, here are those levels:
- 423.6% Fibonacci Extension of March-April Decline ~4790
- 261.8% Fibonacci Extension of September-October Decline ~4800
- 261.8% Fibonacci Extension of November-January Decline ~4775
Again, should the Nasdaq 100 finally hit the target at its 2000 high, this cluster of Fibonacci Extensions may conspire to act as a ceiling for the index as well, at least temporarily.
________
More from Dana Lyons, JLFMI and My401kPro.


