This Indicator Says Don’t Believe Recent Oil Rally
I have mentioned before that it is not our style to try to catch “falling knives” in the financial markets. We just don’t like getting cut. We’ll let others try their hand (or hands) at picking bottoms. We prefer to wait for the downside momentum to cease and for prices to bounce first. Then, we will examine the character and quality of the bounce in an attempt to gauge whether there is potential for a meaningful, longer-term rally or whether it is likely just a bounce. So it was with the rip in oil prices over the past 3 days, and based on one indicator, we would lean toward the “just a bounce” scenario.
With oil, as measured by the United States Oil Fund ETF (ticker, USO), up some 18% in 3 days, some folks have been calling a bottom in oil prices. It certainly has been an impressive bounce. However, we’d remind people that the 18% rally has brought the USO from a loss of 58% since its high in June to a loss of 50%. So it’s merely a blip relative to the preceding decline.
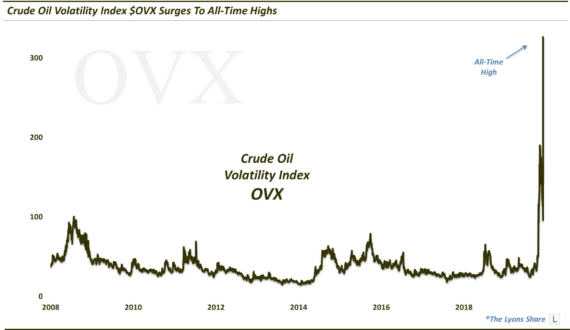
One of the most interesting aspects of the rally has been seen in the pricing of the Oil Volatility Index (ticker, OVX) based on the USO. Like the VIX to the S&P 500, the OVX typically drops when the USO rallies, and vice versa. Therefore, it has been noteworthy to see the OVX actually climb over 9% during oil’s 3-day rally. Since the inception of the OVX in 2008, this was just the 8th time (9th including the day before) that the USO has rallied at least 10% over a 3 day span while the OVX rose as well.
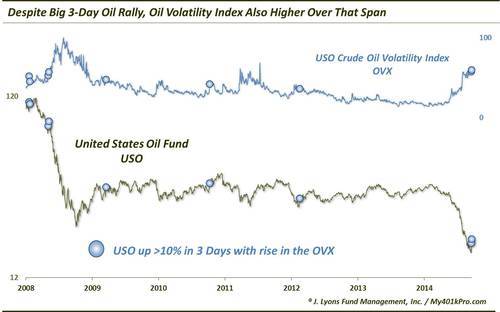
Since 2008, there have been 16 3-day rallies of at least 10% in the USO. The OVX actually was higher on 7 of those occasions and lower on 9. So perhaps the fact that the OVX was up was not so surprising. However, it may be giving a head’s up that the recent jump in oil prices should not be trusted.
Of the 9 3-day 10% rallies in the USO that were accompanied by a falling OVX, 6 saw higher USO prices 6-months later and all but 1 were higher a year later. Those 7 that were accompanied by a rising OVX were not so lucky. They showed poor returns across all time frames from 1-day to 1-year, and consistently so. Here are the numbers.
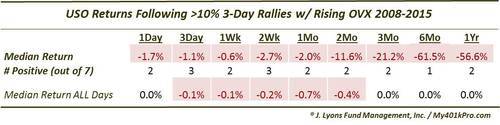
As the table shows, the majority of the occurrences saw negative returns across all durations. And while the USO has had a negative bias over that time period, it has been nothing close to the magnitude following these 7 events. Certainly the 4 occurrences during the crash in 2008 distorted the return figures a little as they showed awful to disastrous returns from 2 months to 1 year out.
The other dates were not encouraging either, however. The February 2011 episode saw the price of the USO managing to chop higher over the following 2 months before collapsing some 30% over the next 4 months. The July 2012 occurrence was the only other one to show a positive 1-year return and the only one that was up 6 months later. However, even that occurrence saw the USO chop sideways over the following 9 months.
Given the action in the Oil Volatility Index (OVX), we would be skeptical toward the rally in oil over the past few days. Previous 3-day rallies of similar magnitude that also saw the OVX rise during the period resulted in consistently lower prices across all subsequent time frames out to 1 year. I.e., those rallies failed. And while a few of the occurrences led to merely choppy or subdued action, several of them (e.g., 2008) led to further substantial losses. One might say, “but, that was during a crash”. We would answer with “what do you think has been occurring recently?” At a minimum, we are not buying this rally (literally or figuratively), and will continue to be skeptical of this market until the character and quality of the oil rallies improve.
________
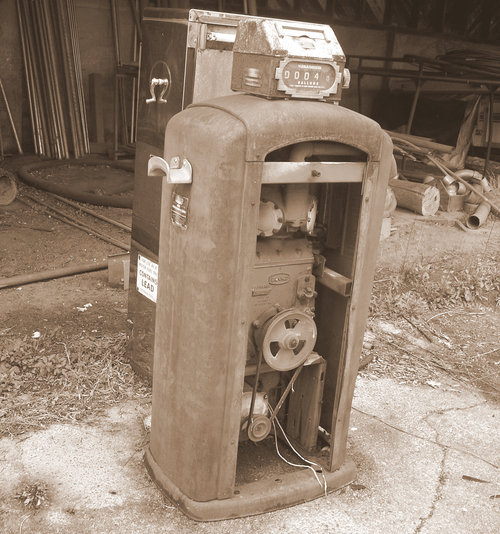
“Gas Was Cheaper Then” photo by jmv0586.
More from Dana Lyons, JLFMI and My401kPro.