Why Nasdaq’s Record Hot Streak May Be Near-Term Downer
Given the ubiquitous media attention, the investment world appears to be fixated on the possibility (and inevitability?) of the Nasdaq’s return to its 2000 record highs. Considering its all-time high close of 5048 is less than 2% away, it seems like a safe bet it’ll get there. And considering the way the Nasdaq has been behaving recently, it appears to be bound to get there sooner than later. In fact, the index is currently in the midst of setting another record, as we’ll show in the second of 2 Charts Of The Day.
First off, a straightforward look at the persistence of the Nasdaq’s current run: as of yesterday, the index has now closed higher on 10 consecutive days.
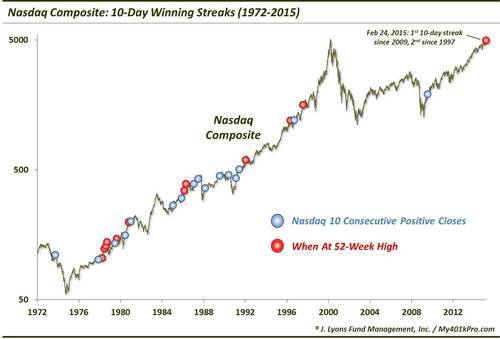
Since 1972, this is the 28th such streak for the Nasdaq Composite. That comes out to about 1 occurrence every 1.5 years, give or take. So it’s a fairly uncommon run. Furthermore, it is the first such streak since July 2009 and just the second since 1997. So despite the parabolic move in the late-1990’s as well as the relentless rally of the past 2 years, this has been an even rarer event over the last 18 years.
We will bypass the topic of why such streaks have been so infrequent lately since we’re not sure how it helps at all. We did take a peak, though, at the Nasdaq’s historical performance following such streaks for any hint of strong tendencies. On the surface, they don’t appear too helpful.
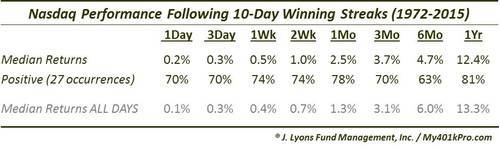
In general, the Nasdaq has tended to display continued strength in the shorter-term, doubling its typical median return over the following month. However, considering the relatively small sample size, there is not a significant variation from the Nasdaq’s typical performance over any of the durations.
However, there is perhaps slightly more usefulness in the results if we break the streaks down into 2 categories: those that occurred with the Nasdaq at a 52-week high (as the index is currently) vs. those that did not.
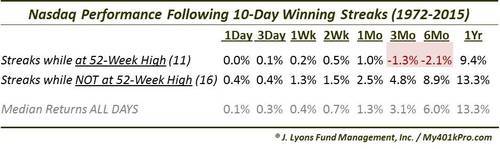
Bearing in mind the limited sample size, the streaks occurring with the Nasdaq at a 52-week high fared much worse, especially in the intermediate-term than did those when the index was not at a high. The median 3-month and 6-month returns were actually negative following streaks at 52-week highs. Although, of the 11 occurrences, just 6 were negative over those respective durations, so it was not an overwhelming percentage of instances that were negative 3 and 6 months later.
However, we do find it significant (if not statistically so) that streaks occurring at highs fared so poorly in the intermediate-term, especially relative to those that were not at highs whose returns were well above typical. Our guess is that these such streaks were at times an indication of exhaustion in the index (in contrast to some streaks not at highs that were a part of a post-correction thrust off of the low). Indeed, this appeared to be the case, in particular, in 1978, 1986, 1992 and 1996. We will point out, though, that the streaks were not necessarily the death knell for such rallies. For despite the poor intermediate-term returns, the Nasdaq bounced back strongly by 1 year later, sporting a median return of +9.4%. This implies double digit returns over the second 6 months following such streaks. This may be something to keep in mind should we get the elusive intermediate-term correction.
Our second chart looks at an actual record set yesterday by the Nasdaq Composite: the index has now closed higher than its open on 11 consecutive days. This is the longest streak in the history of our data (our “open” records go back to 1992.)
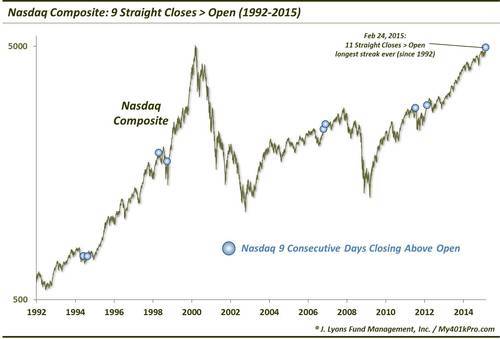
In our view, this phenomenon, i.e., closing higher than its open, is a more telling data point than simply “higher closes”. It removes the opening gap from the equation and measures human (or computer) behavior during daily market hours. Thus in a way, it is an indication of the sense of urgency to participate in the market on the part of buyers. When the Nasdaq closes above its opening price, it indicates a willingness on the part of investors to get involved. That is not necessarily a bad thing as buyers are obviously needed to perpetuate a rally. However, when it reaches an extreme in persistence, it can be an indication that investors’ urgency has become a little too zealous in the short-term. At least, historically that has been the case.
Here is the performance of the Nasdaq following the 8 previous streaks of at least 9 days closing above its open.
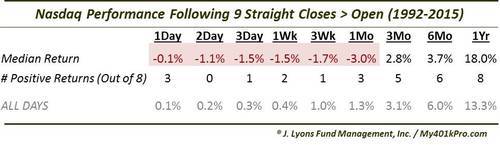
Almost without exception, the Nasdaq tended to struggle in the short-term. 2 days later, all 8 occurrences were lower. 3 weeks later, just 1 was positive. The median returns were negative from 1 day through 1 month. Like the first study, streaks of this nature did not necessarily put an end to the larger bull markets. In the intermediate-term, the returns rebounded back towards typical returns and in the longer-term, returns were actually quite good. In fact, all 8 occurrences were higher a year later by a median of 18%.
However, the short-term returns were a thorn. The consistency of the poor returns from 1 day to 1 month particularly jumps out, even with the small sample size. We can semi-conclude then that these such streaks, in the short-term, can be an indication of an “over-heated” market.
That takeaway marries well with that of the first study showing 10-day winning streaks while at 52-week highs. Each of the studies would suggest that the Nasdaq may be a bit extended in the near-term. That said, history is only a guide and the index appears dead set on reaching its 2000 highs. Should it finally achieve that, it may be due for a (well-deserved) breather.
________
“52:Numbers:13” photo by Richard Paterson.
More from Dana Lyons, JLFMI and My401kPro.


