Will Thailand Be The 3rd Tiger Cub To Break Out?

We have posted articles regarding potential breakouts of 2 of the 4 Asian “Tiger Cubs” so far this year, the Philippines (January 16) and Indonesia (January 22). Each of those markets have since broken out to new all-time highs and, while they still must follow through to prove the breakouts are legit, they have significant potential for continued longer-term gains. Today, we present Thailand as the third possible breakout candidate among the Tiger Cubs, i.e., wanna-be Asian “Tiger Markets” (sorry, Malaysia, but you have a lot more work to do to pique our interests).
After basically quadrupling from 2008 to May 2013, Thailand’s main stock index, the Thailand SET, has been in a holding pattern, very similar to the Philippines and Indonesia. The index sold off roughly 25% into the end of 2013, then subsequently recovered most of those losses into September. Since then, the SET has bounced off that level on 3 occasions (including a December 15 scare that sent the index down over 9% on the day before closing 2.5% lower. Such a move should serve as a reminder of the risks of investing in emerging markets – especially emerging emerging markets.
Since that scare however, the Thailand SET recovered to test the highs it hit at the end of September and early December. It has essentially spent the past 3 weeks consolidating, or coiling, at the level. In the process over the past 20 months, the index has also carved out a possible bullish cup-and-handle formation. This occurs when a market sells off significantly before returning to its prior highs. Subsequently, the market pulls back and pauses briefly to consolidate its gains before eventually breaking out to new highs. While we never anticipate a breakout, this market looks poised to potentially do so.
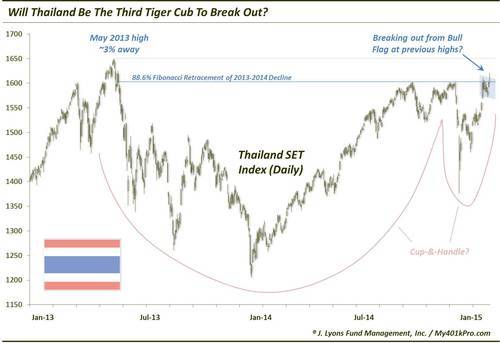
There is significance in the line marking the September, December and recent tops. It marks the 88.6% Fibonacci Retracement of the May 2013-January 2014 decline. The 88.6% level is basically the last line of Fibonacci resistance. Should the index break above there, the May 2013 highs are just about 3% away.
Despite the May 2013 higher highs, the recent highs that the Thailand SET has been contending with may signify the more important barrier. Besides the importance of the 88.6% Fibonacci level, this area also marks the monthly closing high for the index. Therefore, should the index break through current levels, the May 2013 high may not be as formidable a barrier as it appears. That remains to be seen, however.
Speaking of potential cup-and-handles, the post-May 2013 “cup” in the 1st chart may arguably be seen as a “handle” on a larger scale view. Zooming out, we find the index made its all-time high in January 1994. It spent nearly 20 years forming its possible long-term “cup”, culminating in the index’s near full recovery to the 1994 level at the May 2013 high (the index is just 5% away from the 1994 monthly high after losing roughly 90%). The pattern since then, as we discussed in the first chart, may be the handle in the 20-year cup-and-handle.
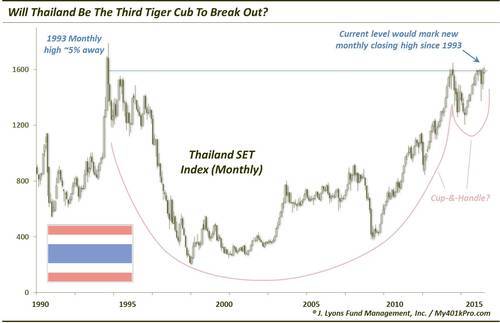
If this read is accurate, there could be major long-term upside potential, should the Thailand SET successfully break out, i.e., the quadrupling since 2008 may only be the beginning. Of course, the proof is in the price. Should the Thailand SET convincingly take out the recent highs, it should have the opportunity for an assault on the 1994 highs, and new all-time highs after that. This has been a tricky index in recent years so we are always on guard for a false breakout as well (those are pretty popular these days). We are on watch, however, to see if Thailand can follow fellow Tiger Cubs, Indonesia and the Philippines into new all-time high territory.
________
“Bangkok Clouds” photo by Mike Behnken.
More from Dana Lyons, JLFMI and My401kPro.