Ireland: One “PIIG” That Can Fly
While they may forever be inexorably linked together, not all PIIGS are the same. By PIIGS (i.e., Portugal, Ireland, Italy, Greece and Spain), we are of course referring to the debt-laden European countries whose economic woes have threatened the stability of the union. These countries have been the source of crisis on several occasions over the past half dozen years or so, in particular in 2012 and presently in the case of Greece. However, not all of the PIIGS have continued to struggle. One of the PIIGS in particular has risen (flown?) above the rest in recent years: Ireland. And what better time to point out the country’s superior performance than St. Patrick’s Day.
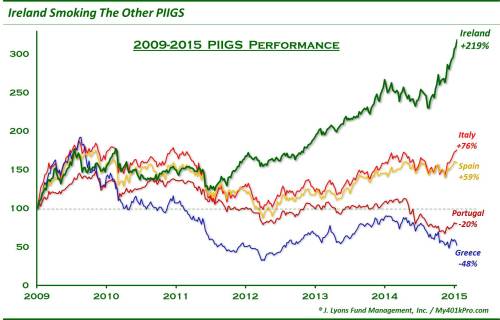
As the chart illustrates, since the lows in 2009, Ireland’s ISEQ stock index is up over two-fold. In fact, through February, the ISEQ Index is up 211.9% versus a gain of 211.1% for the S&P 500. And in comparison to its fellow PIIGS, Ireland’s stock market performance has been even more impressive. The next best performers, Italy and Spain are up 76% and 59%, respectively. Then there is Portugal which is 20% below its 2009 low and Greece whose stock market is half of what it was at its 2009 low.
Here are the PIIGS’ returns since the 2009 low, since the key 2012 low during the height of the PIIGS crisis and since June of last year when many of the PIIGS hit peaks of varying importance.
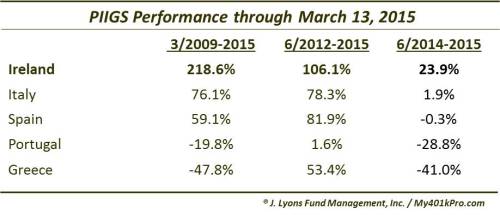
One can see that from the major PIIGS low in 2012, Ireland is handily beating the other countries. Italy and Spain are still well above those lows, as is Greece even. Ireland, however, has doubled Greece’s performance – and doubled its own price since its 2012 low. Portugal meanwhile has given back practically its entire post-2012 rally. Not good.
The top in June of 2014 presented challenges of different degrees for the PIIGS. Portugal and Greece are well off of those respective tops and indeed their weakness over that period accounts for much of their loss since 2009. Conversely, Ireland has since been able to surpass its highs from 2014 by over 20%. This accounts for much of Ireland’s margin of post-2012 outperformance over Italy and Spain which are currently struggling at their 2014 peaks.
So what accounts for Ireland’s separation from its fellow PIIGS? Many economists will point to the country’s aggressive austerity-driven approach to its economic reforms. While we are not economists, and don’t strive to be, we personally are sympathetic to such arguments and applaud such a commitment by the country. And though the nature of Ireland’s economic woes was somewhat different than the other PIIGS, their approach to reform should at least garner some consideration among other debt-burdened, economically-challenged countries.
Lastly, this post is not merely a St. Patrick’s Day backslap to Ireland. Let’s look at the Irish market’s prospects from this point. We mentioned in a post 1 year ago that the major factor impacting the Irish ISEQ Index at the time was the 38.2% Fibonacci Retracement of the 2007-2009 decline. Indeed, it was that precise area where the index topped out in February of last year. That level held until it was able to break out in December. The index has been on a tear since, rising 17% for the year to date to around 6100 currently. This happens to be one of the two key levels we are looking at in terms of potential resistance and/or targets (again, we don’t like to necessarily put “targets” on a chart; rather they are points of potential consequence should prices reach said level.)
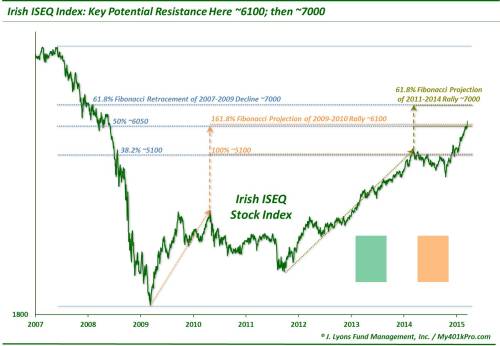
The approximate 6100 level represents the next steps of progression following the 5100 level where the index was halted last year. Specifically, these key points lie in the vicinity of 6100:
- The 50% Fibonacci Retracement of the 2007-2009 Decline ~6050
- The 161.8% Fibonacci Projection of the 2009-2010 Rally ~6100
Should the ISEQ exceed this level, the next stop could be the 7000 area, highlighted by the following lines of importance.
- The 61.8% Fibonacci Retracement of the 2007-2009 Decline ~7000
- The 61.8% Fibonacci Projection of the 2011-2014 Rally ~7000
Whether or not the Irish ISEQ is able to sustain the 6100 level, or attain the 7000 level remains to be seen. However, on this St. Patrick’s Day, Ireland’s economy and stock market probably deserve a hand (or a pint) for their recovery from the depths reached in 2009. Perhaps the country can even secure its removal from the ranks of the “PIIGS”. At a minimum, Ireland at least deserves the title of “prized PIIG”.
__________
“Pink Pig” photo from Flickr.
More from Dana Lyons, JLFMI and My401kPro.
The commentary included in this blog is provided for informational purposes only. It does not constitute a recommendation to invest in any specific investment product or service. Proper due diligence should be performed before investing in any investment vehicle. There is a risk of loss involved in all investments.