UPDATE: European Stocks Hit The Target
In a January 20 post titled “European Stocks Set To Blast Higher?”,we pointed out a potential major breakout in the broad Dow Jones Stoxx Europe 600 Index. This is an update to that post to say that the index did indeed successfully break out and, furthermore, has already hit its targets, based on its chart pattern. Additionally, it is another chance to post this ridiculous picture of Euro-Man blasting out of a cannon. Apparently, he hit the mark.
In the January 20 post, we mentioned the significance of the breakout in the STOXX Europe 600, an index of 600 stocks from around the continent, to 7-year highs:
This is a significant development for the index which had topped back in June (at the 78% Fibonacci Retracement of the 2007-2009 decline) and failed in September and December attempts to surpass those highs. In the process, however, the STOXX 600 formed a bullish inverse head-&-shoulder pattern, with the August and December lows marking the shoulders and the October low representing the head.
Given the successful breakout, these were the potential levels we were watching to the upside and their rationale:
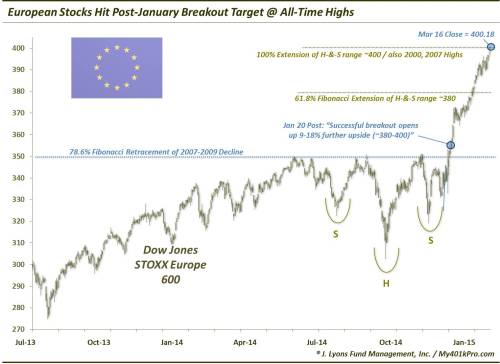
If it is indeed successful, what sort of potential are we talking about for the DJ STOXX Europe 600? While we are not big proponents of setting targets, we could reasonably expect either of the following 2 levels to be reached, given a successful breakout. They are each based on a measurement of the range encompassed by the inverse head-&-shoulder pattern:
- The 61.8% Fibonacci Extension of the range would bring the index to about the 380 level, an approximate 9% gain.
- A 100% extension of the range would target the 2000 and 2007 All-Time Highs around 400, an 18% lift.
The index wasted no time hitting its “targets”. The 380 level was reached exactly 1 month later. And as of yesterday, the 400 level was officially hit with the index closing at 400.18. Here is a chart, displaying the impressive recent action in the DJ STOXX Europe 600.
Despite the euphoria surrounding Europe’s QE program and despite the blistering momentum behind the continent’s stocks, the present 400 level may at least produce a pause in the Stoxx 600. Here is a longer-term chart revealing why.
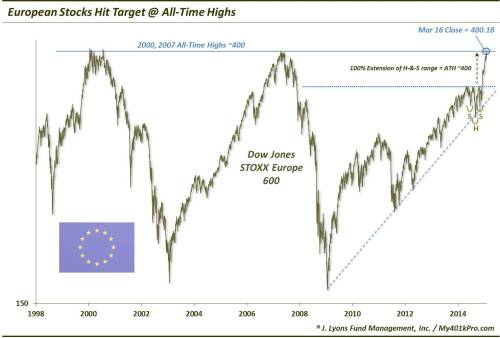
The obvious gorilla in the room here are the 2000 and 2007 highs in the same 400 vicinity. And while triple tops are few and far between, this level should at least see some consolidation of the recent gains before continuing any move to all-time highs.
In recent years, it has been as much the norm to see failed breakouts as it has been to successful ones. Therefore, it is nice to see an index or security occasionally still follow through on what it’s “supposed to do”. Furthermore, it has been a bonus to see the index hit its so-called targets in such a rapid fashion, as if shot out of a cannon, Euro-Man style. However, while its bull run may not be over, with the DJ Stoxx Europe Index now bumping up against its all-time highs, the “easy money” (if there is such a thing) is likely over.
________
“Euro Man” photo by Rock Cohen.
More from Dana Lyons, JLFMI and My401kPro.
The commentary included in this blog is provided for informational purposes only. It does not constitute a recommendation to invest in any specific investment product or service. Proper due diligence should be performed before investing in any investment vehicle. There is a risk of loss involved in all investments.