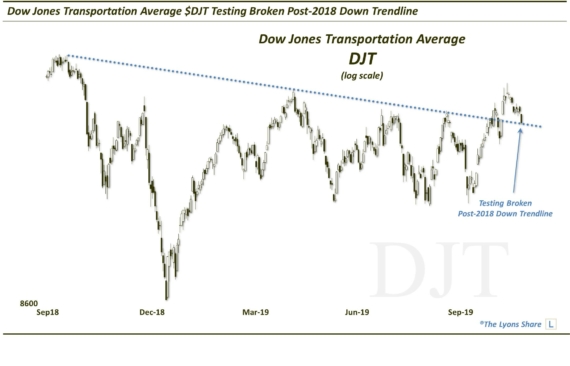
Are Lagging Transports a Sign of Trouble?

The Dow Theory has been covered ad nauseum by others in recent weeks and months. Of course, the Theory is based on the confirmation (or non-confirmation) of new highs by both the Dow Jones Transportation Average and Dow Jones Industrial Average as an indication of a healthy (or vulnerable) overall market. We’re not going to touch on the intricacies of the Dow Theory, nor did we even plan on covering the topic at all. However, one recent development between the two indexes got our attention enough to make it the subject of today’s Chart Of The Day (Night?).
On 2 occasions over the past week, the Dow Transportation Average closed at a 5-month low while the Industrials were actually within 3% of their 52-week high. Whatever the implications of this divergence might be vis-a-vis the formalities of the Dow Theory, it is a pretty surprising, and rare, development. In fact, it has occurred just 20 times now since 1970.
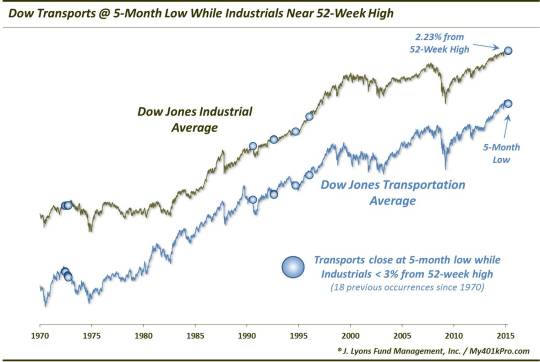
Of all the 5-month lows in the Dow Transportation Average since 1970, yesterday’s occurred with the Dow Industrial Average closer to its 52-week high (2.23%) than all but 2 other days. Also somewhat amazingly given the Transports’ 5-month low, the Industrials have not even made as much as a 2-month low at any time over the past 5 months.
So is this divergence something to be concerned about? The basic spirit of the Dow Theory would suggest yes. However, you won’t be surprised to learn that we ran the numbers to see for ourselves what the impact was on the 2 averages going forward. It turns out, their performance was fairly weak.
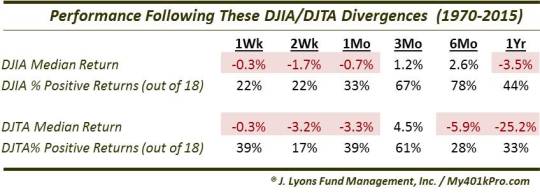
Returns for both indexes were especially poor in the short-term and the long-term, sandwiched around a positive 3-month median return. The most consistently weak time frame was 2 weeks as the Industrials were able to sport gains on just 4 of the 18 occasions while the Transports were up just 3 times. Over the longer-term, you can see that the median returns remained negative even out to 1 year later, with the Industrials at -3.5% and the Transports at a staggering -25.5%.
Of course, a major influence on those numbers is the fact that 12 of these divergences occurred in 1972 on the cusp of a bear market, negatively skewing the results over the longer-term. The balance of the occurrences took place in the 1990′s. That makes the consistency of the shorter-term weakness all the more compelling given the overall positive environment during the decade.
All in all, we probably wouldn’t lean too heavily on the specific results here. A general takeaway regarding confirmations and divergences is probably more appropriate. The Dow Theory implies that divergences between the two indexes carry negative ramifications for the market. At a minimum, this study does nothing to contradict that message.
________
“D-18 Crashed Truck with Drinks” photo by Aquistbe.
More from Dana Lyons, JLFMI and My401kPro.
The commentary included in this blog is provided for informational purposes only. It does not constitute a recommendation to invest in any specific investment product or service. Proper due diligence should be performed before investing in any investment vehicle. There is a risk of loss involved in all investments.