What’s the Next Stop for the Shanghai Composite?

We have mentioned on many occasions that we are not fans of using “targets” to forecast where a stock should go. Rather, we prefer to let prices go where they will without a preconceived bias and react appropriately based on the their movement. At times, multiple charting analyses will align closely around a certain level, increasing the confidence in its importance. However, such a confluence does not guarantee that prices will reach that area – only that it will be a key spot if they do. Thus, the key distinction between adopting “price targets” versus our utilization of techniques to identify potential important price levels is this: a price “target” implies significance and action WHEN prices reach a given level. Identifying, but not projecting the attainment of, key levels helps us to establish a game plan IF prices do reach such levels. A good example of multiple chart patterns aligning to suggest the importance of a certain price level is evident in the Shanghai Composite (SSEC).
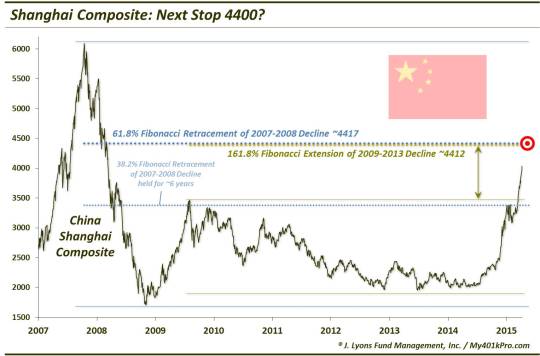
The SSEC famously went parabolic in 2007, jumping about 300% before famously losing the entire gain over the following year. It spent the next 6 years moving sideways before going on a tear to the upside starting last July. Through today’s close, the SSEC is up exactly 100% since its launch 9 months ago. The run has the whole equity universe pondering the index’s fate, with seemingly equal numbers either touting its status as the world’s best investment now or else assured of another eventual crash. Again, we are not going to pick sides. Rather, we will try to remain unbiased in observing the movement in the Shanghai Composite and react appropriately at levels that the chart deems significant. One such level is fast approaching on the upside now.
Most readers may be aware that, after decades of observation, we are of the opinion that Fibonacci numbers play a significant role in the movement of financial markets. And the most important number – the “golden ratio” – is the 61.8% figure. Applying the 61.8% Fibonacci figure to the 2 most influential chart patterns in the SSEC yields an interesting result. First, a 61.8% retracement of the 2007-2008 crash from approximately 6100 down to 1700 produces a level of 4417. Applying a 61.8% Fibonacci Extension above the SSEC’s 2009-2013 range of about 1950 to 3500 yields 4412, almost the exact same level.

The confluence of 2 such significant chart analyses at almost the same precise level should increase the confidence of the importance of that level. Further increasing confidence in the level is the fact that the SSEC has previously and convincingly “respected” a level based on the same analysis. The 2nd most important Fibonacci number in charting is the 38.2% level. The 2009 high in the SSEC came right in the vicinity of the 38.2% Fibonacci Retracement of the 2007-2008 decline – and it held for nearly 6 years. The index finally broke that level in March, but not before pausing there again for 2 months.
Thus, the area just above 4400 should be of major significance to the Shanghai Composite, should it get there. Again, we don’t want to be narrow-minded and assume that the SSEC has to reach that level. Conversely, if it does reach there, we don’t want to dismiss the possibility that it will pass right on through and continue higher. The point is that we have identified a level that key chart techniques strongly suggest should be of significance and we have a game plan ready – IF that level is reached.
________
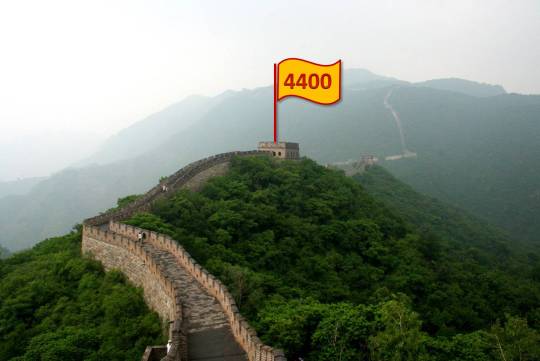
Unedited “Great Wall of China” photo by Robin Zebrowski.
More from Dana Lyons, JLFMI and My401kPro.
The commentary included in this blog is provided for informational purposes only. It does not constitute a recommendation to invest in any specific investment product or service. Proper due diligence should be performed before investing in any investment vehicle. There is a risk of loss involved in all investments.


