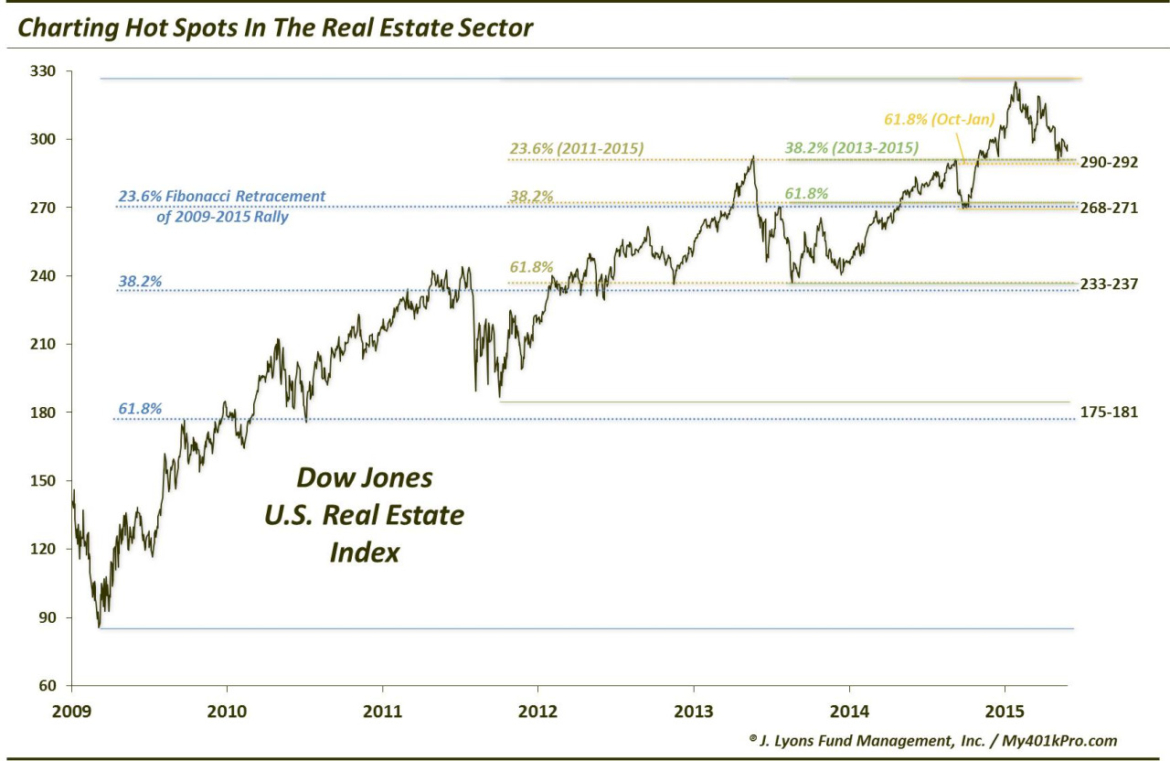
Charting Hot Spots In The Real Estate Sector
In real estate, everyone knows it’s all about “location, location, location”. So it is with trading. If one can accurately locate the important levels on a chart, they have an edge in the market. And when various chart analyses identify the same levels as being significant, it increases confidence that those are indeed the “hot spots” to focus on.
This is currently the case with respect to indices and funds related to the real estate sector – at least when applying Fibonacci Retracement analysis. Once again, Fibonacci numbers represent a specific mathematical sequence often found in nature and other walks of life, including financial markets. Fibonacci Retracement levels refer to markets’ tendencies to display counter-trend moves, or retracements, of similar percentages relative to the prevailing trend. When calculating Fibonacci Retracement levels of an uptrend, we measure the distance from key lows to the rally high and subtract the Fibonacci percentages from that high. When the various Fibonacci Retracements from different key lows align with each other at the same levels, we can be confident that we are locating the correct levels on the chart. Again, this is the case with respect to the real estate sector currently.
As it pertains specifically to the Dow Jones U.S. Real Estate Index (closed on 5/28/15 at 296.85), these are the key levels of potential support showing a confluence of Fibonacci Retracements and other key areas:
290-292:
- 23.6% Fibonacci Retracement of the 2011-2015 Rally
- 38.2% Fibonacci Retracement of the 2013-2015 Rally
- 61.8% Fibonacci Retracement of the October-January Rally
- June 2013 Highs
- September 2014 Highs
- Post-2009 UP Trendline
268-271:
- 23.6% Fibonacci Retracement of the 2009-2015 Rally
- 38.2% Fibonacci Retracement of the 2011-2015 Rally
- 61.8% Fibonacci Retracement of the 2013-2015 Rally
- October 2014 Lows
232-237:
- 38.2% Fibonacci Retracement of the 2009-2015 Rally
- 61.8% Fibonacci Retracement of the 2011-2015 Rally
- November 2012 Lows
- August 2013 Lows
175-181:
- 61.8% Fibonacci Retracement of the 2009-2015 Rally
- October 2011 Lows
Of course the prospects of the real estate sector are substantially tied to interest rates. If rates can arrest their recent rise and resume their former downtrend it would bode well for real estate, especially at current levels near the initial 290-292 support area. If rates continue higher, look for real estate to drop further, with an eye on the next levels listed above.
________
More from Dana Lyons, JLFMI and My401kPro.
The commentary included in this blog is provided for informational purposes only. It does not constitute a recommendation to invest in any specific investment product or service. Proper due diligence should be performed before investing in any investment vehicle. There is a risk of loss involved in all investments.