Dow Divergences Part 3: The Double Dose

Today, we wrap up our mini-series on divergences among the Dow Jones indices. In previous installments, we learned that large negative divergences on the part of the Dow Jones Transportation Average (DJT) versus the Dow Jones Industrial Average (DJIA) were largely overrated. Of course, that is partially due to the “Dow Theory” hype associated with the two indices which makes it difficult to live up to its reputation. On the other hand, flying under the radar are large divergences between the Dow Jones Utility Average (DJU) and the DJIA. These such divergences have actually been very consistent as harbingers of stock market trouble over the past 60 years.
This post follows the natural progression by combining the two studies. That is, what has happened historically when both the DJT and DJU were showing large negative divergences while the DJIA was at a 52-week high. By large, we mean that both the Transports and Utilities were more than 5% from their own 52-week highs, as we have seen over the past week. This double divergence has been triggered on now 58 days since 1955.
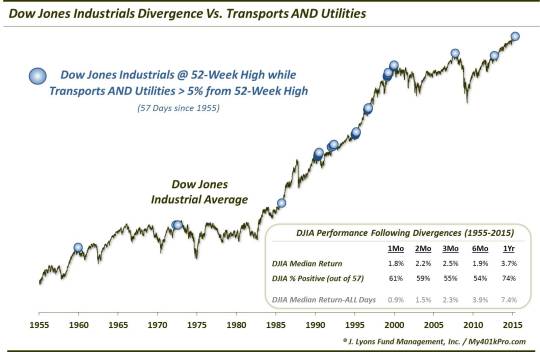
What are the implications of these sizable divergences? Well, considering the fact that we basically combined the two prior studies, perhaps it’s no surprise that the results lie somewhere in the middle of the two, i.e., worse than the Transportation divergences but not as bad as those involving the Utilities. Specifically, here is a table of the forward performance of the DJIA following all such divergences.
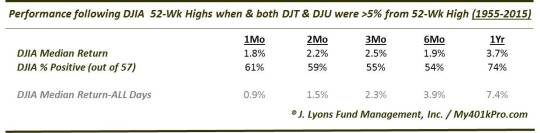
As you can see, there were no real ramifications in the short-term. Longer-term, however, the DJIA tended to underperform its typical standards. The median 6-month and 1-year returns were half of what they have been historically. All-in-all, though, the returns were not especially noteworthy either way.
That said, the divergence did trigger at numerous major market tops, as divergences often do. These tops include 1960, 1972, 1990, 2000 and 2007. So there is some fodder for the bears. However, also like most divergences, this one has given its share of false signals as well. The majority of these occurred during the strong run up in stocks during the mid-1990′s. So there is hope for the bulls as well. I guess it just depends on which type of market regime is currently in place.
This is a decent example of a divergence on which to end the series. What we have found was what we have already known to be true about divergences. They are far too-often cited as they produce many false signals as well as early signals. Even the signals that end up being prescient are difficult to capitalize on due to the challenge of timing them right. If one can time them, however, they can be a valuable tool in identifying major turning points.
Is that the case with this current divergence? It is impossible to know. If this market environment is similar to the mid to late-1990′s, it could be that it will plow right through this and all other divergences. However, if the market is reverting back to a more “normal” one in which stocks move in cycles both up and down, this divergence may be meaningful. If that’s the case, considering much of the evidence that we have compiled in this blog over the past few months, the market could be vulnerable to a substantial decline.
_____________
“road away” photo by David DeHetre.
More from Dana Lyons, JLFMI and My401kPro.
The commentary included in this blog is provided for informational purposes only. It does not constitute a recommendation to invest in any specific investment product or service. Proper due diligence should be performed before investing in any investment vehicle. There is a risk of loss involved in all investments.