One Gauge Of Investor Sentiment Just Hit A 6-Year High

There’s no question that the general level of stock investor sentiment is at historically high levels at this time. However, I think it’s probably safe to say that much of this bullishness has accrued gradually due to the cumulative stock market gains over the past 6 years. What has largely been absent, though, despite the elevated sentiment are examples of veritable investor euphoria. We are talking about bursts of frenzied, “get-me-in-at-all-costs” type of buying behavior. We did see traces of it over the past 2 years, especially in early 2013, but nothing consistent. Yesterday, however, we did see a possible example of this type of euphoria from the International Securities Exchange.
We have mentioned the ISE several times over the past year as their options ratios have become favorites of ours in gauging short to intermediate-term investor sentiment. The ISE “Equity” Call/Put Ratio has been especially helpful, at times, in identifying extremes in short-term sentiment. This series has decent volume and behaves in an orderly, “normal” fashion that renders its extremes particularly valid as accurate measures of sentiment. The “Index & ETF” Call/Put Ratio (the ISE uses call volume in its numerator as opposed to the denominator like most sources do) has at times been helpful as well. However, it has mostly been too erratic to be consistently reliable. That said, the reading of this ratio yesterday was so extreme that we thought it was worthy of today’s Chart Of The Day.
Specifically, the ISE Index & ETF Call/Put Ratio registered its highest reading (228) in over 6 years.
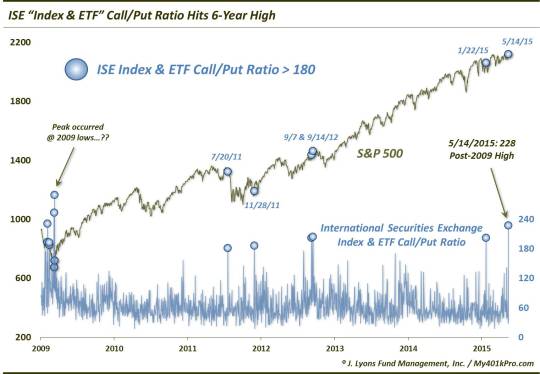
At 228, the reading means that call volume at the ISE was more than double put volume. In the last 6 years, that is just the 4th time that has occurred. These are the dates of all of the readings above 180 since 2009, along with the aftermath in the S&P 500.
- July 20, 2011 The S&P 500 hit a high the following day before dropping 16% over 12 days.
- November 28, 2011 The exception as the S&P 500 was jumping off a short-term low and would rally 6% over the next week.
- September 7 & 14, 2012 The S&P 500 hit a high on the 14th and proceeded to drop nearly 8% in the next 2 months.
- January 22, 2015 The S&P 500 hit a high that day before dropping 3.3% over 6 days.
So one can see why yesterday’s reading would make us take notice. It hasn’t been unanimous, but 3 of the 4 other readings above 180 in the past 6 years led to immediate selling pressure, some mild and short-term and some more serious and over the intermediate-term.
Now, there are some obvious asterisks we would place on this study. For one, the November 2011 event led to more buying instead of selling. Secondly, as we mentioned, this series has been very erratic throughout the years and thus, hard to depend on.
And third, consider the last time this indicator flashed readings this high: March 9 & 11, 2009. Of course, that was THE exact cyclical market low. So what gives? We’re not sure. The ETF’s that received the highest volume on those days were essentially the same as those from yesterday. Perhaps this particular exchange was used by unique market participants or for alternate options strategies at the time that reflected non-contrarian sentiment extremes instead. Perhaps some of our readers have an explanation for the nature of the readings back then, and why they have changed.
Whatever the reason, over the past 4 years, the ISE Index & ETF Call/Put Ratio has typically been a contrarian indicator, when at extremes. Thus, yesterday’s most bullish reading in 6 years is likely not a welcomed sign for stock market bulls. It could be an example of the euphoric type of investor behavior that has been mostly missing from the general bullish sentiment picture. A few more of these examples and we would really be concerned about stocks in the immediate-term.
_____________
“Bull smile” photo from emofaces.com.
More from Dana Lyons, JLFMI and My401kPro.
The commentary included in this blog is provided for informational purposes only. It does not constitute a recommendation to invest in any specific investment product or service. Proper due diligence should be performed before investing in any investment vehicle. There is a risk of loss involved in all investments.