Country Spotlight: In The “Swede Spot”?
If you read our blog on a regular basis, you’ve probably noticed a theme over the past week or so: Europe. We have posted charts and analyses on various equity markets across the continent, including individual countries as well as broad Europe indices. The reason being is that many of the markets are showing the same characteristics – and potential opportunity – at this time. The template goes like this:
- Markets broke out to new highs in January
- They have pulled back from April to June
- The momentum & significance of the breakouts suggest the upside efforts are not finished
- They are hitting potential key support levels currently
As we showed with the STOXX Europe 50, the German DAX and the French CAC-40, much of the potential support comes by way of Fibonacci Retracement levels. Drawn from key lows, such as the January breakout level, the October 2014 lows, the summer of 2012 lows and even the 2009 or 2002 lows, many of the Fibonacci levels line up nearly perfectly with each other. As we have said before, when this occurs, we gain confidence in the significance of such levels.
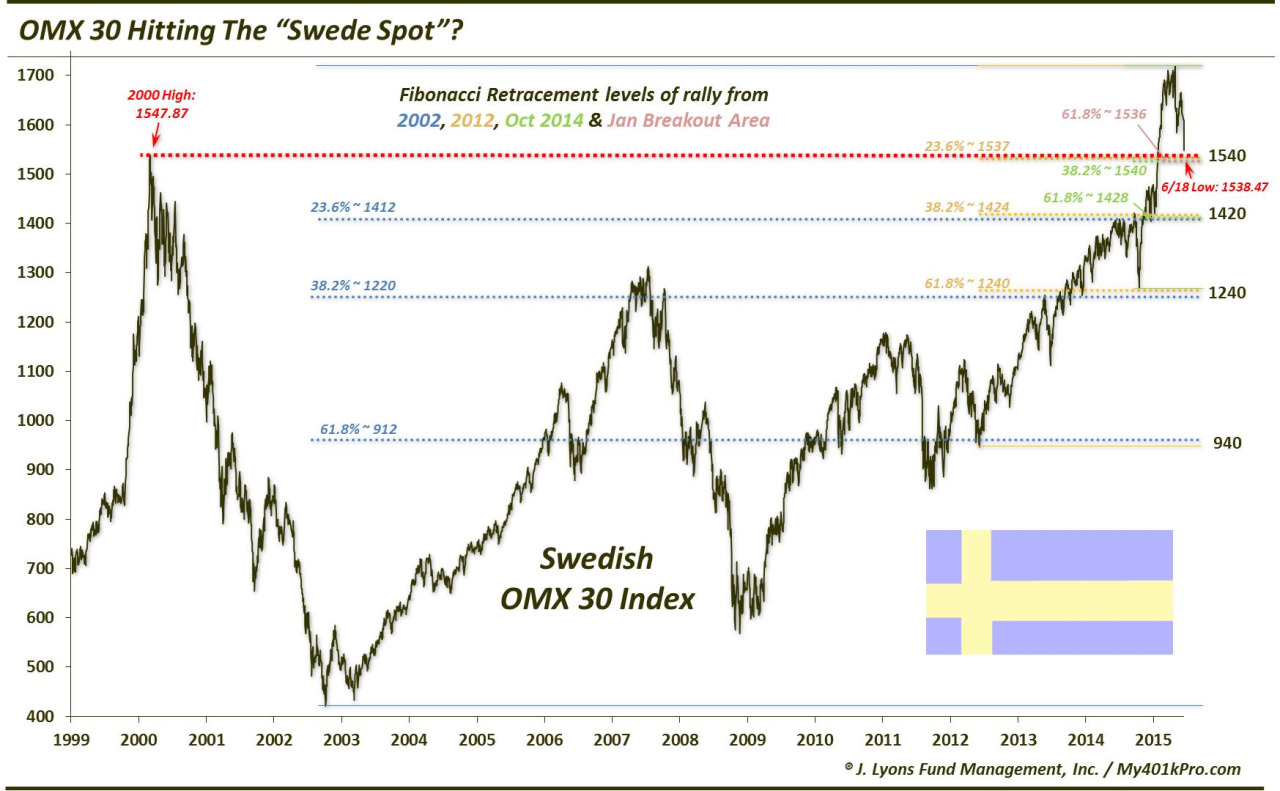
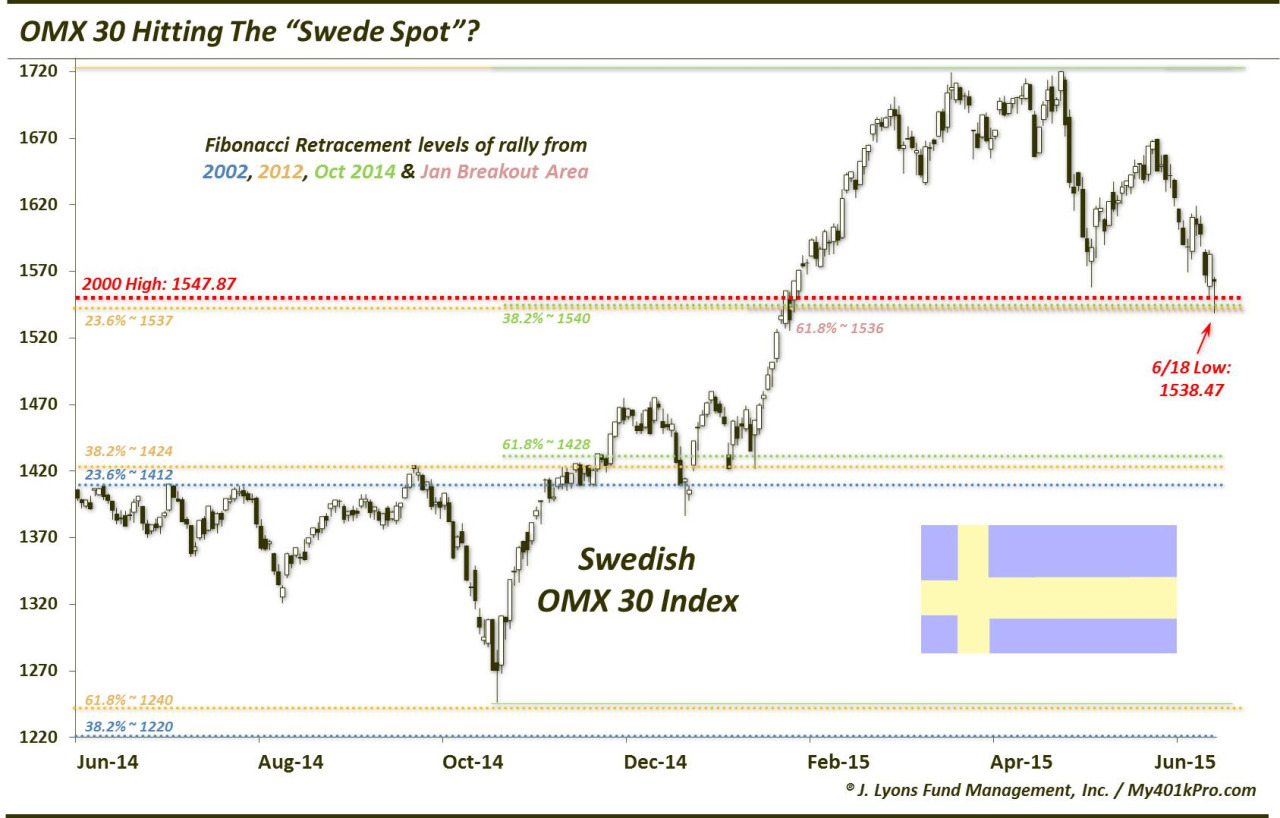
It is the same story for Sweden’s OMX Stockholm 30 Index. This may even be the most attractive target because it has a kicker. The current conluence of support also comes at the very same level as the former all-time high from 2000, which it surpassed earlier this year.
Here is what we are seeing on the chart as potential support:
~ 1540 (the OMX-30 hit a low of 1538.47 today before bouncing 1.8%):
- 23.6% Fibonacci Retracement of the 2012-2015 Rally ~ 1537
- 38.2% Fibonacci Retracement of the October-April Rally ~ 1540
- 61.8% Fibonacci Retracement of the January Breakout Area-April Rally ~ 1536
- 2000 High @ 1547.87
Should this area fail, the next confluence of potential support comes in around 1420, as represented by these levels:
- 23.6% Fibonacci Retracement of the 2002-2015 Rally ~ 1412
- 38.2% Fibonacci Retracement of the 2012-2015 Rally ~ 1424
- 61.8% Fibonacci Retracement of the October-April Rally ~ 1428
- January Breakout Area ~ 1424
Those are the key levels that should hold any retracements following the breakout. A move back to the 1420ish level would retrace the entire post-breakout gain. While the level would likely serve as temporary support, a full retracement in such short order would not be the best case scenario. It may suggest the breakout will possibly be a failure. Now, if it returns to that level down the road, i.e., years from now, it may be a different (better) story. Of course, the chart would need to be analyzed again to take interim changes into consideration.
Below those levels, the next area to keep on the back burner in case prices should make their way down here in the (hopefully distant) future would be near 1240, as marked by:
- 38.2% Fibonacci Retracement of the 2002-2015 Rally ~ 1220
- 61.8% Fibonacci Retracement of the 2012-2015 Rally ~ 1240
- October 2014 Lows ~ 1247
Additionally, should the index indeed bounce here, initial potential resistance levels above may be 1608 (38.2% Fibonacci Retracement of the April-June decline) and 1650 (61.8%). These levels may be something to watch as the DAX and STOXX 50 indices were each turned away precisely at their respective 38.2% levels after last week’s bounces.
Like other markets across Europe that we have highlighted, Given the momentum behind the January breakout in Sweden’s OMX-30, our view is that it is too soon to write off potential further upside. Therefore, the pullback during this 2nd quarter may be considered merely a counter-trend move until proven otherwise. If correct, the key levels we identified may serve as support. Especially significant in the immediate-term is the support level around 1540, right near today’s low. Thanks to the confluence of Fibonacci levels, as well as the kicker of the 2000 high being in that vicinity, it may prove to be a “Swede spot” for bulls.
________
More from Dana Lyons, JLFMI and My401kPro.
The commentary included in this blog is provided for informational purposes only. It does not constitute a recommendation to invest in any specific investment product or service. Proper due diligence should be performed before investing in any investment vehicle. There is a risk of loss involved in all investments.