Charting A Course In European Stocks
Early this morning we posted a piece titled “German Stocks Ready For Another Drive Higher?, laying out a technical case for a resumption in the German DAX’s post-January breakout rally. In this piece, we take a quick look at the chart of the continent-wide Dow Jones STOXX 50 Europe Index. However, the story is essentially the same as the DAX, so if you’d like a little more color on the general German/European equity picture, I recommend you take a look at that earlier post.
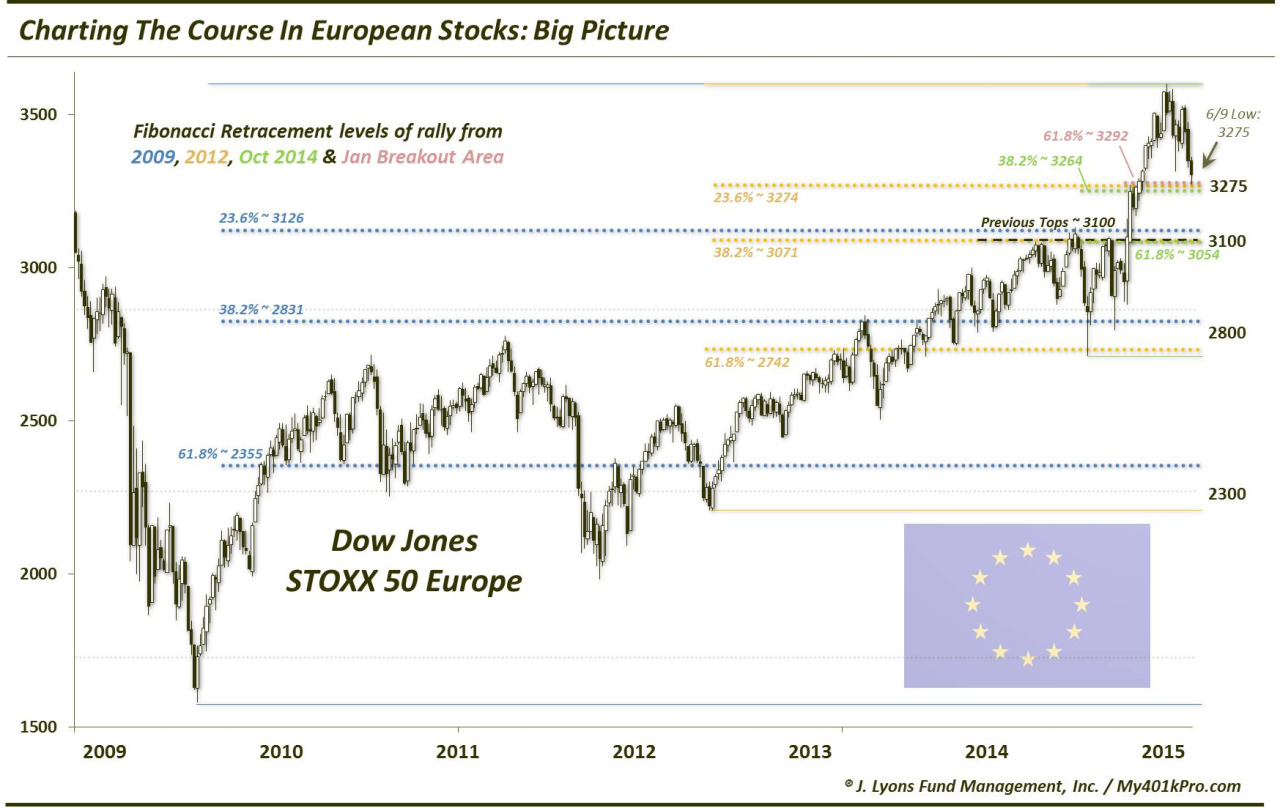
For the STOXX 50, we are simply going to run down some potential areas of support, including a key one that held precisely yesterday. Again, we are using Fibonacci Retracements (mainly) in determining those levels. As with the DAX, many of the key Fibonacci lines from the major lows line up in close proximity with each other. When this occurs, it reinforces the significance of the levels.
Here are the those such levels:
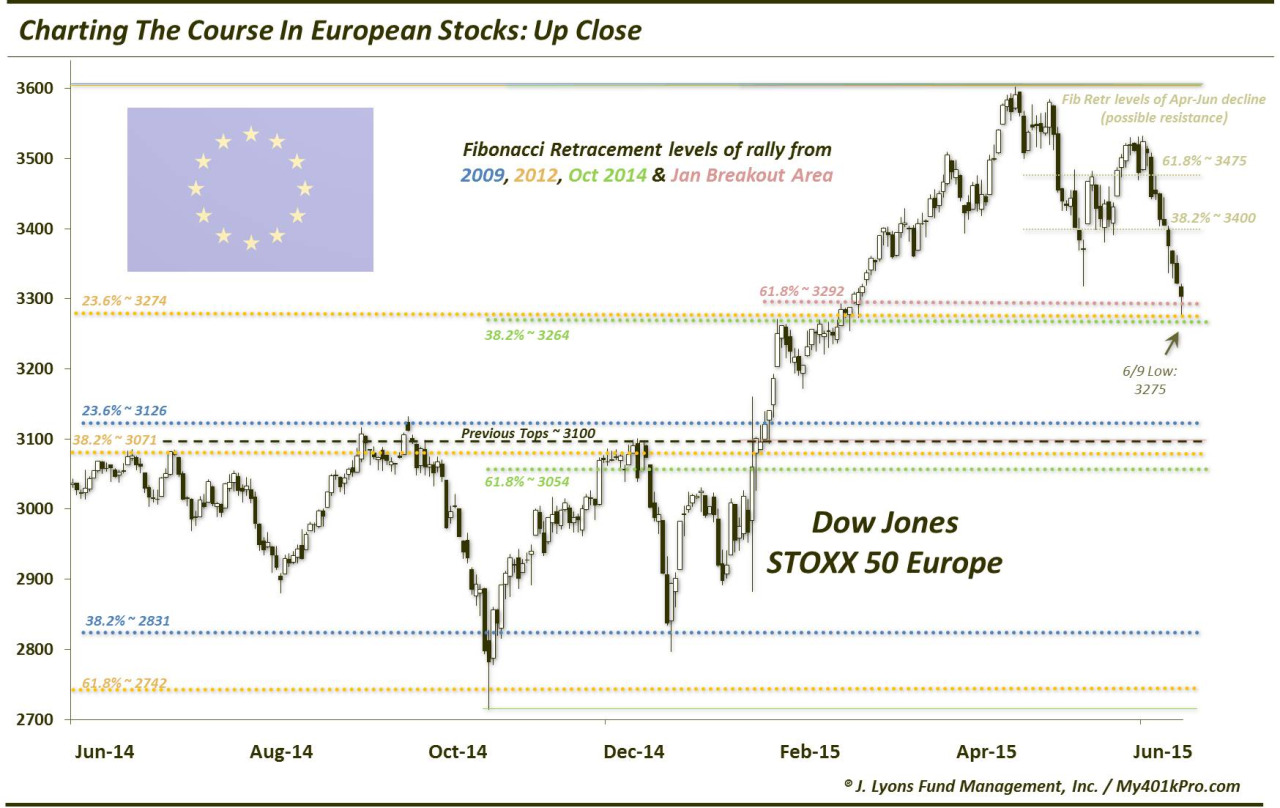
3275 (*yesterday’s low in the STOXX 50 was 3275*):
- 23.6% Fibonacci Retracement of the 2012-2015 Rally ~ 3274
- 38.2% Fibonacci Retracement of the October-April Rally ~ 3264
- 61.8% Fibonacci Retracement of the post-January Breakout Rally ~ 3292
3100:
- 23.6% Fibonacci Retracement of the 2009-2015 Rally ~ 3126
- 38.2% Fibonacci Retracement of the 2012-2015 Rally ~ 3071
- 61.8% Fibonacci Retracement of the October-April Rally ~ 3054
- Breakout Area/June-December 2014 highs ~ 3100
Those are the key levels that should hold any retracements following the breakout. Actually, a move back to 3100 would retrace the entire post-breakout gain. And while the level would likely serve as temporary support, a full retracement in such short order would not be desirable as it would suggest the breakout will quite possibly be a failure. Now, if it returns to that level down the road, i.e., years from now, it may be a different (better) story. Of course, the chart would need to be analyzed again to take interim changes into consideration.
Speaking of “down the road”, here are some levels to keep on the back burner in case prices should make their way down here in the (hopefully distant) future:
2800:
- 38.2% Fibonacci Retracement of the 2009-2015 Rally ~ 2831
- 61.8% Fibonacci Retracement of the 2012-2015 Rally ~ 2742
- October 2014 Lows ~ 2714
2300:
- 61.8% Fibonacci Retracement of the 2009-2015 Rally ~ 2355
- June 2012 Lows ~ 2210
With today’s 2+% rally, obviously a bounce is well underway. The 3275 level held perfectly and as long as it does, the index can move higher. A couple potential areas of resistance may be 3400 (38.2% Fibonacci Retracement of the April-June decline) and 3475 (61.8%). The jury is still out on the fate of the post-January breakout rally in European equities. However, at a minimum, it is a positive that the Dow Jones STOXX 50 Europe bounced “where it should”.
________
More from Dana Lyons, JLFMI and My401kPro.
The commentary included in this blog is provided for informational purposes only. It does not constitute a recommendation to invest in any specific investment product or service. Proper due diligence should be performed before investing in any investment vehicle. There is a risk of loss involved in all investments.