A Record “Close But No Cigar” Streak For Stocks

If it feels like stocks have been hanging near their highs for a long time without being able to break out, you aren’t imagining things. By one measure, stocks have never traded so close to their highs for this long without breaking out, at least based on the Nasdaq Composite. Specifically, the Comp has traded 12 consecutive days (today would make 13) within 1% of its highest daily high of the past 52 weeks – without exceeding it. This is the longest such streak ever, going back to 1971, eclipsing the previous record of just 9.
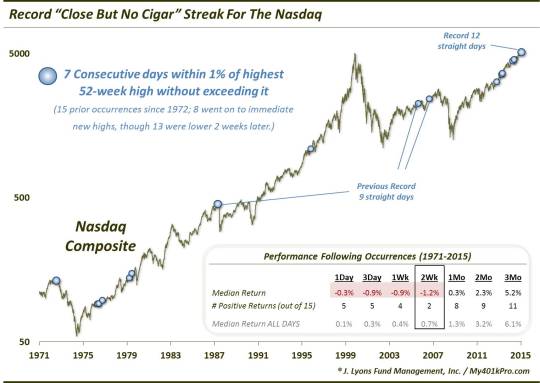
What is the significance of this record “close but no cigar” streak? Are new highs inevitable? Well, without any historical precedent, we have to loosen the parameters a bit to find somewhat similar occurrences. Therefore, we looked for historical streaks lasting 7 days whereby the Nasdaq traded within 1% of its 52-week high without breaking above it. Since 1971, there were 15 such prior streaks.
What did the index do afterward? Unfortunately, but not surprisingly, there was no one road map that fit each of the events. The Nasdaq went on to an almost immediate high (i.e., no intermittent selloff) on 8 of the 15 occasions. Therefore, it failed to make a new high in short order on 7 occasions. In that respect, a new high is not necessarily inevitable.
What were the typical returns like following these streaks? Here is a table of the median returns as well as the number of positive returns over the subsequent days, weeks and months.
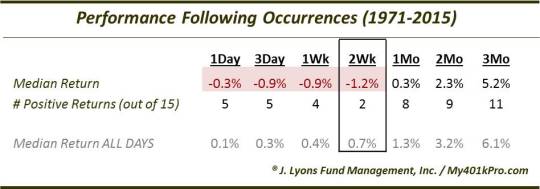
In the short-term, the Nasdaq tended to show weakness, though nothing major. 3 days later, the index was down 10 times by a median -0.9%. The most consistent tendency was out to 2 weeks. The Nasdaq was down on all but 2 of the occasions, with a median loss of -1.2%. That suggests that despite the fact that over half of the streaks went to new highs almost immediately, the new highs did not stick. At least that is the short-term tendency. By the intermediate-term time frame of 2-6 months, returns reverted back in line with the historical norm.
The same holds true for longer-term returns (not shown on the table). In general, they have been in line with normal returns. However, there were 2 occasions that marked significant longer-term tops. Those streaks occurred in November 1972 and September 1987. The Nasdaq entered prolonged bear markets (or crashes) following each of those streaks. While the odds (2 out of 15) certainly don’t favor that outcome in our present case, the possibility cannot be dismissed either, especially given many of the concerns we’ve outlined in this blog.
The bottom line? They say that “close only counts in horseshoes and hand grenades”. The phrase would appear to apply to the stock market’s record streak of days near, but not above, its 52-week high. The Nasdaq’s prolonged close proximity to its 52-week high does not guarantee inevitable new highs. For while new highs have transpired in short order about half the time following such streaks, they have not been sustainable on a consistent basis. At least in the near-term.
________
More from Dana Lyons, JLFMI and My401kPro.
The commentary included in this blog is provided for informational purposes only. It does not constitute a recommendation to invest in any specific investment product or service. Proper due diligence should be performed before investing in any investment vehicle. There is a risk of loss involved in all investments.