Bets On Volatility Rise The Highest Since 2008

There has been an odd trend of late in stock sentiment readings. Despite major averages that are near all-time highs, sentiment has dropped considerably across many of the measures we track. It is true that many of the readings are moving down from historically bullish readings in the beginning of the year. However, some sentiment surveys are actually registering extreme bearish readings even on an absolute level (see these excellent posts from fellow YahooFinance Contributors Ryan Detrick and Joe Fahmy for more analysis and specific examples on this development).
We are hard-pressed to come up with a satisfying reason for this trend. One possibility is that, in this age of information awareness and distribution, perhaps folks taking part in the sentiment surveys had themselves become aware of the sky-high sentiment and dialed back their enthusiasm – either out of concern for the skewed bullishness or to avoid becoming part a contrarian “dumb money” market top statistic. While there may be something to this theory, there is one problem. It is not only the sentiment surveys that are showing this trend, but real money indicators as well (which we prefer).
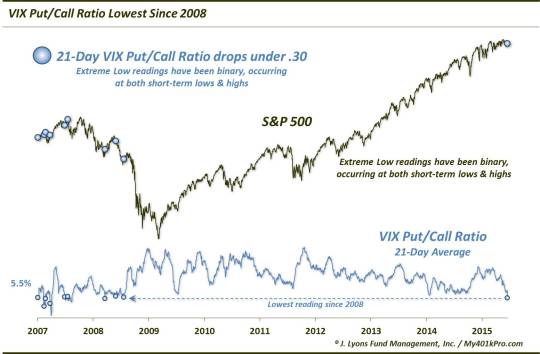
One such example comes from options trading on the S&P 500 Volatility Index, better know as the VIX. As most observers are aware, the VIX tends to rise as the stock market declines. Thus a rising VIX is associated with bad markets. The interesting thing about present conditions in VIX options is that the Put/Call Ratio (using a 21-day average) is at the lowest level since the summer of 2008. That means that there are more bets on a rising VIX versus bets on a falling VIX than we have seen in 7 years. And again, a rising VIX is associated with bad markets.
So, again, here is another example of significant levels of fear, despite indices near their highs. We aren’t sure exactly what all is at play here, particularly as this volatility market is already a derivative of the equity market. Therefore, there may be all sorts of different hedging strategies being deployed in coming up with this mix of put and call options. However, the gist remains – folks would not have so many hedging strategies on if they were not willing to bet on rising volatility, and perhaps by extension, falling equity prices. Therefore, on the surface this would appear to be a contrarian bearish sign for the VIX and a bullish sign for equities.
That said, an asterisk is appropriate when applying this data series as a contrarian sentiment reading. That’s because, unlike most sentiment measures, the track record of the VIX Put/Call Ratio suggests it is not a cut-and-dry contrarian signal. That is, extreme low readings historically have not always come at market lows. In fact, the strange thing about low readings historically is that they have come both at intermediate-term lows and highs.
For instance, the current 21-day average of the VIX Put/Call Ratio is 0.28 as of June 18. We have to go back to 2008 to find occasions when the Ratio dropped below 0.3. Since the options didn’t start until 2006 and were fairly thin and whippy for the first year, we really only have 2007-2008 to locate potentially reliable readings below 0.3%. The timing and future returns following such readings were actually quite binary.
Occurrences in January, March and June 2007 and March and July 2008 led to almost no rise in the VIX over the following month. At the same time, the S&P 500 showed essentially zero drawdown over that period, rising 3-7% each time over the next month. Additionally, in January 2008, a near-miss reading of 0.31 led to an instant 4% rise in the S&P 500 without practically any increase in the VIX.
On the other hand…
Occurrences in February and July 2007 and May 2008 led to a minimum rise of 70% in the VIX over the next 6 weeks. At the same time, the S&P 500 suffered 6-week drawdowns of -5%, -9% and -13%.
So you see the interpretation isn’t that straightforward. And obviously since there haven’t been any readings this low since 2008, we cannot judge more contemporary instances. Lowering the bar, we do find relative extreme low readings in July 2009 and February 2010, concurrent with intermediate-term market lows/VIX highs, i.e., dumb money. Then again, the next lowest readings occurred in April and July 2011 and April and September 2013, near short to intermediate-term market tops/VIX lows, i.e., smart money (note: the VIX Put/Call did bottom in the first week of August 2011 along with the market, but it was already extremely low before the market sold off).
Again – essentially binary and ambiguous market action in the readings’ aftermath. The most recent examples of extreme low readings may or may not settle the debate. Before this week, the three lowest readings in the VIX Put/Call Ratio since 2009 came in January, July and September 2014. And while you may immediately think “the market has gone straight up during that time”, each reading was followed by short-term weakness in the market and short-term strength in the VIX. The S&P 500 saw a 1-month drawdown of -5%, -3% and -7%, respectively, following the three occurrences. And while that may not sound like much weakness (and it isn’t really), relative to what we’ve seen recently, it would probably seem like a crash. Meanwhile, the VIX saw 1-month jumps of 70%, 60% and 150% following the three readings. That’s nothing to sneeze at, even though those jumps were coming from very low levels.
And ultimately, that may be the simple answer to the best interpretation of an indicator that measures bets on the VIX rising versus bets on the VIX falling: traders are betting that the VIX will rise. Considering the low level in the VIX, it wouldn’t take much of a rise to bring a pay day for these traders, even if it is not accompanied by a concomitant big drop in equities.
What it means for equities is unknown. It is possible that the “smart” readings in 2007 and 2011 are most relevant considering their location in the market cycle, i.e., after multi-year rallies. We don’t have a good answer for that. We do typically give the benefit of the doubt to more recent readings with regard to such indicators. In that light, perhaps the reading is somewhat of a concern given the 2014 readings that saw weakness shortly after – at least in the short-term. Whether or not that is the best read on the indicator, we should find out fairly soon.
Btw, a hat tip to sharp-eyed @hmeisler who apparently tweeted out the same chart yesterday, unbeknownst to me.
_____________
More from Dana Lyons, JLFMI and My401kPro.
The commentary included in this blog is provided for informational purposes only. It does not constitute a recommendation to invest in any specific investment product or service. Proper due diligence should be performed before investing in any investment vehicle. There is a risk of loss involved in all investments.

