Dow Divergences Reaching Historic Levels

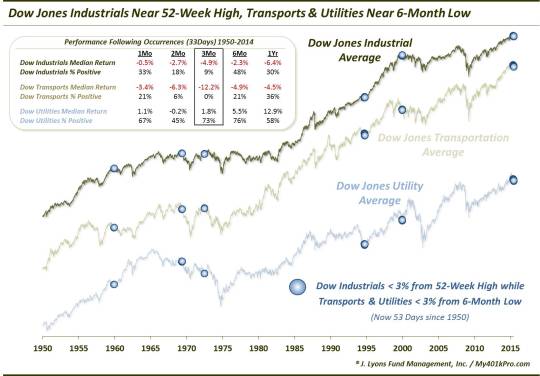
Since 1929, the Dow Jones Industrial Average has rarely ever been so close to a 52-week high while the Dow Transports AND Dow Utilities were so close to a 6-month low.
A few weeks ago, we ran a series on divergences in an attempt to provide some statistical evidence to the debate on this ambiguous topic. Given the attention paid to the Dow Theory (i.e., the relationship between the Dow Industrials [DJIA] and the Dow Transports [DJT]), several of the posts were focused on it, as well as the interplay with the Dow Utilities. The general takeaway from the series was the same thought we had going into the studies: divergences are present at a lot of major market tops, but also at a lot of other times as well. That is, divergences are like most everything else – at times, phenomenal signals but unreliable.
Of course, the impetus behind the timing of the series on divergences was the presence of several of them at the time. And while many of them are still present today, we have resisted covering them further for a couple reasons. For one, we were tired of posting research on divergences. Secondly, one of the conclusions we reached was that, even in the cases where they eventually prove meaningful, divergences can persist for a long time before any repercussions. Therefore, while there continue to be divergences, we have found nothing new to report regarding them. Until now, that is.
While we don’t want to get lured too far down the divergence road again, there is one more angle to the divergences among the Dow indices that has recently caught our attention. Over the past few weeks, the Dow Jones Industrial Average has traded at or very close to its 52-week high. At the same time, the Dow Transports AND Dow Utilities have traded at or near 6-month lows.
Specifically, on June 10, the DJIA was less than 2% away from its 52-week high while the DJT and DJU were less than 1% away from their 6-month lows. That was just the 3rd day in history (since 1929) that we can find such circumstances – September 19, 1994 and December 9, 1999 were the others.
Even loosening the parameters a bit, it has been rare to see the DJIA so close to its highs while the other 2 averages were so close to their lows. From 1935-2014, there were just 33 days on which the DJIA was within 3% of a 52-week high while the DJT and DJU were within 3% of a 6-month low. The last 6 weeks have seen an additional 20 such days.
The previous 33 occurrences mostly happened in 5 clusters:
- November-December 1959
- May 1969
- June 1972
- September 1994
- December 1999
What transpired following the previous instances? Like every study, the returns going forward were mixed, especially in the short-term. However, in the intermediate-term, the returns were decidedly not mixed. They were negative, at least for the DJIA and the DJT. For the DJU, it was a different story.
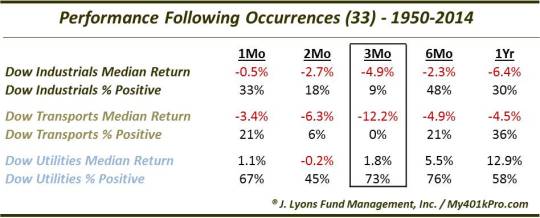
The median return for the DJIA and DJT was negative on all time frames, from 1 month to 1 year. Things were particularly bad – and consistently so – at the 3-month marker. The median 3-month return in the DJIA was -4.9% with just 3 of the 33 days showing a positive return. The DJT was worse. Not a single day of the 33 saw a positive 3-month return, resulting in a -12.2% median return. Again, many of these occurrences came in clusters, however those are still pretty consistent results.
The DJU, interestingly enough, showed not only positive returns from 3 months to 1 year, it actually had above-average returns. This is likely partially explained by the fact that the average had already been severely beaten down on several of the instances in the sample. Meanwhile, the DJT, while near a 6-month low was not down nearly as much as the DJU on most of the occasions. So there was likely some mean-reversion effect to the Utilities’ returns.
Incidentally, regarding the dates mentioned above: following 9/19/1994, the DJIA, DJT and DJU went sideways for 6 months before exploding to new highs. Meanwhile following 12/9/1999, the DJIA and DJT bounced for 1 month before topping for the next 5-7 years. The DJU, meanwhile, put in an immediate low that would last for 2.5 years.
So what is takeaway from this new look at the Dow divergences? Is there any new information or wisdom to be gleaned by it? Probably not. It is most likely just evidence to suggest that while divergences can persist for awhile, this one can be put into the “awhile” camp at this point. Its separation has now reached historic proportions and we would guess that, if the divergence is to mean anything, it will likely be known soon and felt over the intermediate-term.
_____________
“road away” photo by David DeHetre.
More from Dana Lyons, JLFMI and My401kPro.
The commentary included in this blog is provided for informational purposes only. It does not constitute a recommendation to invest in any specific investment product or service. Proper due diligence should be performed before investing in any investment vehicle. There is a risk of loss involved in all investments.