French Stocks: Tarts Or Toast?

Back on April 17 we tweeted a chart showing France’s CAC-40 stock index kissing (and being rejected by) the post-2000 down trendline, which also connected the 2007 highs. We heard some snickers at the time from the “anti-technical analysis/price movement is random” crowd regarding the meaninglessness of the event. Now, we don’t claim that there is no randomness to price movements nor that technical tools are infallible. However, we also cannot understand the utter dismissal of such tools as useless, given the ample evidence to the contrary. We’ll happily leave our rant at that and enjoy the benefits afforded us by the widespread skepticism of technical analysis tools. Today, we just want to demonstrate one more example – on the CAC-40 – of the relevance of technical/charting tools and offer a reading on what this analysis may be suggesting going forward for this particular market.
First of all, let’s update the April chart of the CAC-40′s kiss of the down trendline and see what has transpired in the 2 months since.
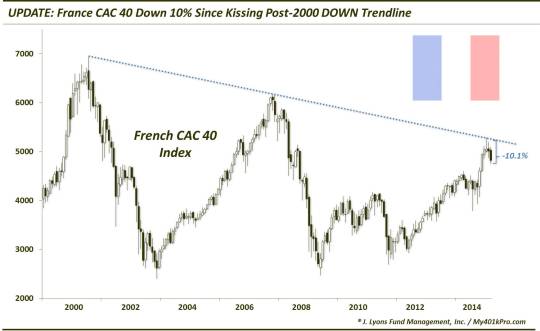
As the chart reveals, after the perfect kiss of the trendline, the CAC-40 has dropped steadily for 2 months. At -10.1% as of today’s low, the index “officially” reached correction territory off of the trendline level. Now, it is possible that the 2-month straight-down decline in the CAC-40 following the trendline touch was a completely random reaction, and we cannot prove otherwise. However, the financial markets sure are prone to a lot of “random” movements like this.
Anyway, onward and (perhaps) upward. What does our analysis of the CAC-40 chart suggest may be the next “random” movement in the index? Well, like the German DAX and the STOXX Euro 50 that we covered last week, the CAC-40 is hitting a potentially significant juncture. Like those other indices (among others across the continent), the CAC-40 experienced a breakout of sorts in January. We say “of sorts” because it was a bit different than the other indices in that the CAC-40 broke out from a descending consolidation or continuation pattern while the others broke out above lateral resistance. That suggests that the longer-term potential may be slightly less significant than the DAX and STOXX 50, etc. Indeed, the CAC-40 had obstacles like the post-2000 trendline with which to contend. The other indices did not have such issues.
In the near-term, however, the CAC-40 is in the same position the other indices were in last week. After the explosive January breakout, the index ran into the trouble at the trendline in April. Given the nature of the breakout, however, the likelihood is that its upside momentum has not been exhausted. Therefore, any pullback should be treated as a counter-trend move rather than the start of a new extended decline – in our view. Thus, the index should afford traders the opportunity to attempt longs at some point, and at the right price. We may be at one such price now.
Like the indices we covered last week, the CAC-40 hit near a confluence of potential support levels today, stemming from key lows and inflection points over the past 3 years.
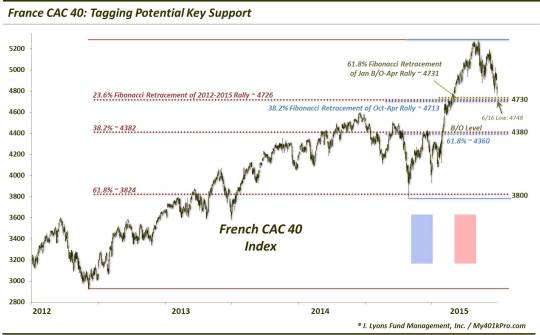
Specifically, the index made a low today at 4748. This is in the vicinity of the following potential key levels:
- 23.6% Fibonacci Retracement of the 2012-2015 Rally ~ 4726
- 38.2% Fibonacci Retracement of the October-April Rally ~ 4713
- 61.8% Fibonacci Retracement of the January Breakout Area-April Rally ~ 4731
Should this area fail, the next confluence of potential support comes in around 4380, as represented by these levels:
- 38.2% Fibonacci Retracement of the 2012-2015 Rally ~ 4382
- 61.8% Fibonacci Retracement of the October-April Rally ~ 4360
- January Breakout Area ~ 4400
Those are the key levels that should hold any retracements following the breakout. Actually, a move back to 4380-4400 would retrace the entire post-breakout gain. And while the level would likely serve as temporary support, a full retracement in such short order would not be desirable as it would suggest the breakout will quite possibly be a failure. Now, if it returns to that level down the road, i.e., years from now, it may be a different (better) story. Of course, the chart would need to be analyzed again to take interim changes into consideration.
Speaking of “down the road”, the next level to keep on the back burner in case prices should make their way down here in the (hopefully distant) future would be near 3800, as marked by:
- 61.8% Fibonacci Retracement of the 2012-2015 Rally ~ 3824
- October 2014 Lows ~ 3789
Additionally, should the index indeed bounce here, initial potential resistance levels above may be 4950 (38.2% Fibonacci Retracement of the April-June decline) and 5080 (61.8%). These levels may be something to watch as the DAX and STOXX 50 indices were each turned away precisely at their respective 38.2% levels.
Given the momentum behind the January breakout in the CAC-40, our view is that it is too soon to write off potential further upside. Therefore, the pullback during this 2nd quarter may be considered merely a counter-trend move until proven otherwise. If correct, the key levels we identified may serve as support. Especially significant in the immediate-term is the support level around 4730 near today’s low. If the CAC-40 is able to hold this level, it has the potential to provide for some sweet upside for bulls. The inability, however, to hold this area could be a blow to investors. For while the potential support levels we identified lower may provide for a temporary bounce, the failure to hold current levels may suggest that, in the longer-run, French stocks are toast.
________
More from Dana Lyons, JLFMI and My401kPro.
The commentary included in this blog is provided for informational purposes only. It does not constitute a recommendation to invest in any specific investment product or service. Proper due diligence should be performed before investing in any investment vehicle. There is a risk of loss involved in all investments.