German Stocks Ready For Another Drive Higher?
Given the poor action in the European equity markets in the 2nd quarter, it may be easy to forget that the continent was the place to be in the 1st quarter. Specifically, Germany was perhaps the star of all global equity markets in the 1st quarter, outside of China (do we even have to apply that qualifier anymore?). After leading a herd of European bullish breakouts in January, the German DAX Stock Index finished the quarter up 22%. So the -8% drop in the DAX during the 2nd is tough, but a little perspective is probably in order for those pronouncing the European equity rally over.
Let me say that we are not optimistic about the prospects for the developed equity markets in the U.S. or Europe over the longer-term (i.e., the rest of the decade?). However, that does not necessarily apply to every intermediate-term period along the way. During those times when price dictates a bullish stance, we will certainly dampen our pessimism. We still may be in one of those times. And the main influence behind such a consideration continues to be the aftermath of the January breakout.
The coordinated breakouts across the continent brought many bourses to multi-year or all-time highs. This wasn’t some feeble fluke – this was powerful stuff. We have compared it to the early 2013 breakout in the U.S. markets which spurred a 2-year rally, so far. The European breakout suggests that the continent is following the market cycle of the U.S. though with a lag. Whether that is sound analysis or not, the nature of the breakouts still warrant the benefit of the doubt.
In terms of the German DAX, the January breakout brought the index into new high ground. However, the index had previously surpassed its 2000 and 2007 highs during a 2013 breakout, similar to the U.S. markets (the October 2014 low was actually a near-perfect test of that breakout). Therefore, its particular move is not necessarily in its infancy and, thus, it may not have the explosive upside potential it would otherwise. That said, the impressive breakout in January should still have potential positive reverberations. We certainly would not write off the market due to an 8% decline, coming off the heels of a huge 1st quarter. Such a pause is actually normal (with apologies to the Autobahn, not every market can pull a “Shanghai Express” and run straight up for 12 months.)
Therefore, in light of that view, it is appropriate to analyze the chart of the DAX for potential key support levels should the pullback encounter them (newsflash: the DAX just hit one).
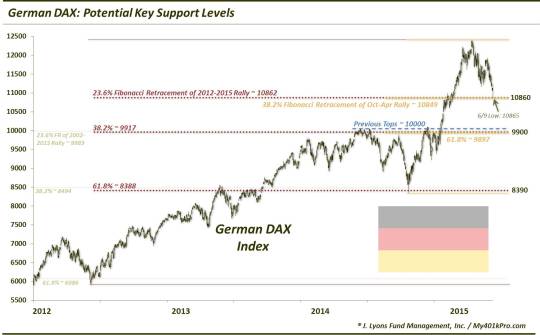
In doing so, we have found that various lines of significance line up in close proximity with one another. When this occurs, we tend to gravitate towards the chart as the confluence of analyses near the same level gives us confidence in the significance of the level. In this case, much of the focus is on Fibonacci Retracement levels of the rallies from key lows in October 2014, June 2012 and 2002 to the recent April peak. As the Fibonacci levels from these lows all match up in close proximity with one another, they also line up near the actual lows as well, i.e., a Fibonacci Retracement from one low lines up with a market low above it.
For the DAX, here are the levels that we are looking at as potential key areas of support:
10,860 (*yesterday’s low in the DAX was 10,865*):
- 23.6% Fibonacci Retracement of the 2012-2015 Rally ~ 10862
- 38.2% Fibonacci Retracement of the October-April Rally ~ 10849
9900:
- 23.6% Fibonacci Retracement of the 2002-2015 Rally ~ 9983
- 38.2% Fibonacci Retracement of the 2012-2015 Rally ~ 9917
- 61.8% Fibonacci Retracement of the October-April Rally ~ 9897
- Breakout Area/June-December 2014 highs ~ 10000
Those are the key levels that should hold any retracements following the breakout. Actually, a move back to 9900-10,000 would retrace the entire post-breakout gain. And while the level would likely serve as temporary support, a full retracement in such short order would not be desirable as it would suggest the breakout will quite possibly be a failure. Now, if it returns to that level down the road, i.e., years from now, it may be a different (better) story. Of course, the chart would need to be analyzed again to take interim changes into consideration.
Speaking of “down the road”, here are some levels to keep on the back burner in case prices should make their way down here in the (hopefully distant) future:
8390:
- 38.2% Fibonacci Retracement of the 2002-2015 Rally ~ 8494
- 61.8% Fibonacci Retracement of the 2012-2015 Rally ~ 8388
- October 2014 Lows ~ 8355
6000:
- 61.8% Fibonacci Retracement of the 2002-2015 Rally ~ 6086
- July 2012 Lows ~ 5914
Given the momentum behind the breakout earlier this year in Germany (and European) stocks, our view is that it is too soon to write off their rallies. Therefore, the pullback in the DAX during this 2nd quarter may be a normal, healthy counter-trend move rather than the beginning of a new bear market. If correct, key levels of potential support may be identified by investors/traders for re-entry. We have identified such levels that we view as significant. The first such level was tagged precisely yesterday. We will find out if this level can turn the DAX around and send it off to the races again.
Drive safely.
________
“Autobahn” photo from freefoto.com.
More from Dana Lyons, JLFMI and My401kPro.
The commentary included in this blog is provided for informational purposes only. It does not constitute a recommendation to invest in any specific investment product or service. Proper due diligence should be performed before investing in any investment vehicle. There is a risk of loss involved in all investments.