Global Equity Index Sitting On The Precipice

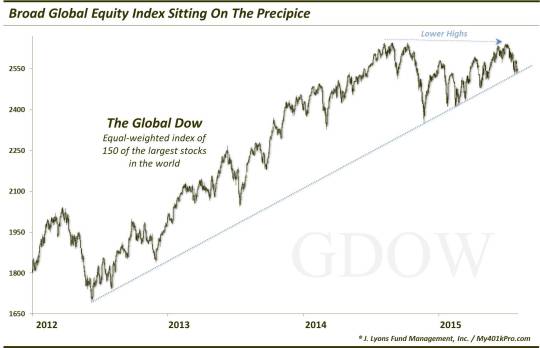
We often wait for developments to occur before issuing a Chart Of The Day. It tends to be more interesting to say “check out what just happened!” than “well, this may happen…and it may not”. Yes, markets typically fall into the latter category but typical isn’t exactly Chart Of The Day material. However, given the action (or lack thereof) in global markets of late, it is appropriate to present a “maybe/maybe not” chart today. Therefore, we present to you a chart of The Global Dow equity index, which is currently sitting squarely on its post-2012 UP trendline.
What in tarnation is The Global Dow? It is a broad equity index made up of 150 of the largest stocks around the world. Its components are also weighted equally so its behavior can provide perhaps a decent read on global equity breadth. That said, it is heavily weighted toward the U.S. so domestic stock action can exert perhaps undue influence on the movement of The Global Dow. Here is the weighting by countries around the globe:
USA 42.27%
Japan 9.97%
Great Britain 8.30%
France 6.85%
Germany 4.74%
Switzerland 4.62%
China 3.05%
India 2.39%
Spain 2.29%
Hong Kong 2.20%
Brazil 1.86%
Canada 1.64%
South Korea 1.52%
Australia 1.37%
Italy 1.15%
Mexico 0.96%
Taiwan 0.79%
Portugal 0.73%
Finland 0.68%
Sweden 0.64%
Russia 0.54%
Greece 0.44%
Norway 0.40%
Denmark 0.32%
Netherlands 0.29%
(More information on The Global Dow can be found here.)
All in all, The Global Dow is not the worst representation of global equities in general, despite the flaws in the index. This is to say nothing of the flaws in the concept of even attempting to construct a gauge of the “global” equity market. Markets are so compartmentalized that A) it is difficult to create an accurate universal gauge and B) it is not clear what benefit such a gauge would provide (besides providing an income stream for indexers and fund companies, of course).
Back to the chart. What is the takeaway? It is simple. The Global Dow is sitting squarely (at the moment) on its post-2012 UP trendline line, which happens to lie at about 2536 today. This trendline also connects the lows of October 2014 as well as the lows of January, February and June of this year. A close below the trendline would presumably be bearish for equities in general. And one reason why a breakdown may come soon than later is the frequency of the trendline touches recently. As the duration between touches of a trendline or support/resistance line decreases, the odds of a break increase. Therefore, it would not surprise us to see a breakdown sometime soon.
So who would be affected most? And what action would a breakdown warrant? Those are questions that are difficult to answer, or that we cannot answer. Obviously, there would be significant impact on the owners of the Global Dow ETF (ticker, DGT). Outside of that, it is tough to extrapolate the precise ramifications of a breakdown. As with any chart, our recommendation is to analyze the developments on that price series itself rather than to attempt to trade other products by extension.
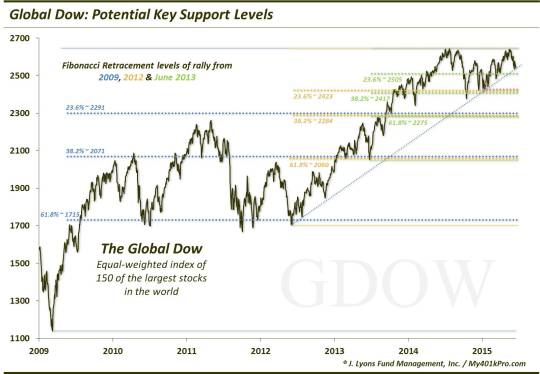
In other words, we typically prefer to judge each asset or security based on its own merits. So let’s look at potential key levels in The Global Dow. (it may surprise you to learn that, despite very little money trading off of the specific index, it follows technical levels – Fibonacci in particular – very closely). This chart indicates some levels that may provide support in the event of a trendline break (e.g., roughly 2500, 2420, 2280, 2060 & 1715):
Again, these levels are contingent upon a trendline break. And while we suggested the odds of a break soon are likely considerable, we never want to anticipate a breakdown. Therefore, we will watch and react if and when such a breakdown occurs. At that point, it will likely be a negative for equities globally – in general. For now, we’ll assume the trendline acts as support, until it doesn’t. The fact that it is resting squarely on the trendline going into today’s FOMC meeting adds a little intrigue to the meeting and the markets, as if they need it.
________
“World on knife edge” photo by ChazGoes.
More from Dana Lyons, JLFMI and My401kPro.
The commentary included in this blog is provided for informational purposes only. It does not constitute a recommendation to invest in any specific investment product or service. Proper due diligence should be performed before investing in any investment vehicle. There is a risk of loss involved in all investments.


