Europe Bull Scenario Remains On Course
About a month ago, we laid out a case for another up-leg in European equities. The case was built strictly off of a technical, charting basis that essentially went like this:
- European equity averages broke out to new highs in January
- The averages have pulled back from April to July
- The momentum & significance of the breakouts suggest the upside efforts are not finished
- The averages are hitting potential key support levels
Interestingly, the pattern was generally consistent across the equity bourses throughout the continent. We covered the STOXX Europe 50, the German DAX and the Swedish OMX 30, but could have easily inserted France or Finland or a host of other European averages that were tracking the same pattern. The homogeneity of the action, whether bullish or bearish, across markets suggested to us that the pattern was indeed relevant. We happened to think the setup was potentially a bullish one.
In our prior posts, we identified the key support levels mentioned in step 4 above, based primarily on Fibonacci Retracement analysis. Indeed, on several occasions in mid-June, the markets held precisely at such levels, precipitating bounces. At the same time, there were a few ingredients missing that would turn the bullish setup from very good to near-ideal. We alluded to one of those in a June 16 tweet:
One thing working AGAINST immediate Euro equity levels holding: STOXX 600 support is still ~1.8% lower…FWIW.
The key broad European equity gauge, the STOXX 600, had yet to reach its own key support levels akin to those of the markets we mentioned. Thus, if the STOXX 600 (and a few other markets including Belgium and the Netherlands) was to eventually visit its key support levels, it would suggest that the markets we originally covered would likely break below their key support.
The other missing ingredient from an “ideal” setup a month ago had to do with waves – as in price patterns, not the ocean. Ideally, we like to see price moves unfold in waves of 5 before anticipating a reversal. In the case of a down move, that would consist of 3 down waves with 2 intermittent up waves. In the middle of June, there had arguably been just 2 down waves since April. Now A) declines do not need to consist of 3 down waves and B) a miscount of the waves is certainly a possibility (i.e., the late-June re-test could have been interpreted as a wave 3 down). However, in our analysis, it was quite clear that the post-April decline had exhibited just 2 waves down through June.
Thus, we entered July with 2 potential snags in our European bullish scenario: further room on the downside in a key European index and a potential 3rd wave lower. Last week, these 2 developments began to unfold, leading many of the European averages to break their identified support levels. However, it did not necessarily spell doom for the bull thesis. As we stated in a July 7 tweet:
…cont: Immediate downside: ~5-8%. HOWEVER, if Euro mkts reclaim Fib levels in short order (200SMA may help), bull scenario not diminished.
Amidst last week’s Grexit hoopla, European markets did reclaim their key Fibonacci levels in short order, spending just 2 days below them. Several of them hit their 200-day moving averages as mentioned in the tweet, aiding their bounce capabilities. That “false breakdown” among the averages arguably constituted a third wave down in their post-April declines. This also occurred as the STOXX 600 dropped to precisely tag its own key Fibonacci support levels. Thus, the 2 missing ingredients to the bullish European equity scenario were added, completing the puzzle.
Here is a look at the STOXX 600 with last week’s touch of its Fibonacci levels as well as its 200-day moving average and the 3 labeled down waves:
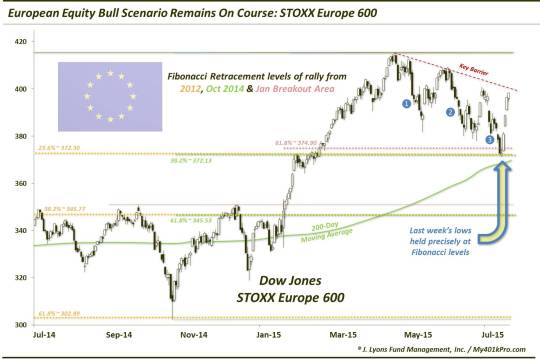
As the chart shows, 3 key Fibonacci levels all line up where the index bottomed last week around 372 (the STOXX 600 hit a low of 371.33 on July 8 and made a closing low of 372.74 on July 7):
- 23.6% Fibonacci Retracement of the 2012-2015 Rally ~ 372.30
- 38.2% Fibonacci Retracement of the October-April Rally ~ 372.13
- 61.8% Fibonacci Retracement of the January Breakout Area-April Rally ~ 374.90
The index has already bounced some 8% off of its low of last week, demonstrating the significance of the support level we identified. This speaks to the importance of being able to accurately identify key support levels. The ability to buy a security at those levels means you know quickly if you are wrong. Therefore, your stop-loss can be reasonably close by meaning you are not risking much on the trade. Meanwhile, the potential reward is significant, in particular versus the risk. And that is what successful investing is all about: finding favorable risk:reward ratios. In this case, the ratio was extremely favorable as the risk was just below where the index bottomed. At the same time, the reward, in just the short-term, was 8% just to bring the index back to the top of its downtrend channel.
Furthermore, if European markets are indeed to form a new up-leg, the long-term risk:reward ratio is off-the-charts favorable as the meat of the rally has arguably not even commenced. As mentioned, the STOXX 600 is now facing its most critical test in the downtrend line from its April top. This is likely the key barrier standing in front of a new up-leg. If the STOXX 600 can overtake the downtrend line, it could ignite such a rally. And if the STOXX 600 is able to move to new highs, it would be particularly significant to this index because its former all-time highs set in 2000 reside in the same general vicinity. Thus, a breakout would obviously be momentous.
We have been touting the potential of a new bull leg in European equities for a month now. The thesis was built largely on our identification of a key cluster of Fibonacci support levels in many of the indexes across the continent. Those levels have successfully held for most of the averages, including the STOXX Europe 600. And the averages that did fall below their respective support levels, were able to reclaim them in short order. Thus, the bull thesis not only remained intact, but has arguably been strengthened as 2 missing ingredients to the bullish setup have now been added. All that remains is for the indexes to break above their post-April downtrend lines, then their April highs. While that may not unfold immediately, it looks promising since the bull scenario has thus far essentially unfolded precisely according to plan. It is not often in this business that we can say that.
__________
“European Bull” photo by Rock Cohen.
More from Dana Lyons, JLFMI and My401kPro.
The commentary included in this blog is provided for informational purposes only. It does not constitute a recommendation to invest in any specific investment product or service. Proper due diligence should be performed before investing in any investment vehicle. There is a risk of loss involved in all investments.