Even The Stronger Areas Of The Market Are Starting To Weaken

We’ve spent the past few days in this space noting the recent thinning of the stock market advance. That is, despite the major averages continuing to hover near their 52-week highs, the internals are becoming uglier by the day. The main takeaway from this trend is that, should the relatively few areas of the market that are keeping it afloat begin to weaken, there will be precious little support left to prevent a significant correction. Indeed, we are beginning to see signs of deterioration now even among the stronger areas of the market. For example, the technology-heavy Nasdaq 100 (NDX) has been one of the stalwarts of this bull market rally, leading the recovery of the past few weeks to new all-time highs. However, even among its ranks, the NDX is really starting to thin out.
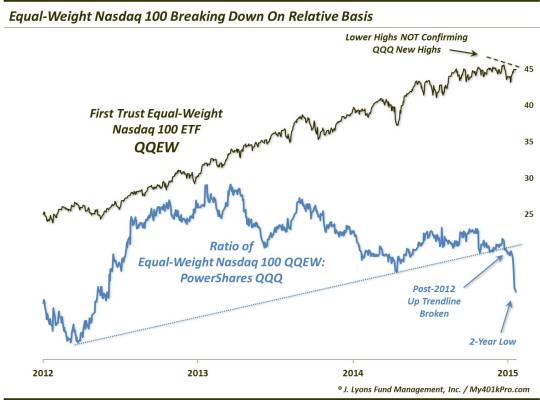
Witness the action in the equal-weight NDX, as represented by the First Trust Equal-Weight NDX ETF (Ticker, QQEW). Since this fund places an equal weighting on each of the consitituents, its performance is a good barometer of the overall health of the Nasdaq 100. And as the NDX powered some 3% above its previous highs over the past week, the QQEW has been unable to follow suit. In fact, it hasn’t even come within 1% of its June high. Furthermore, the ratio between the QQEW and the market cap-weighted NDX, as represented by the Powershares NDX ETF (QQQ) has recently broken its post-2012 uptrend and is presently plummeting to 2.5-year lows.
One might say that the strength lies in the biggest-cap names in the NDX and that they continue to perform well enough to boost the index. That is true, but our point is that, should those mega-caps begin to lose their footing, the sector will be subject to similar weakness as that being felt throughout an increasing large swath of the market. Today, we are witnessing just that as one of those leading mega-caps, Apple (AAPL), is getting taken to the woodshed. Due to AAPL’s massive weighting in the index, this is putting serious pressure on the Nasdaq 100 index.
Furthermore, similar breakdowns in the the equal-weight:cap-weight NDX ratio in the past have resulted in significant eventual damage to the cap-weighted NDX as well. Specifically, when the QQEW:QQQ ratio has hit an 18-month low while the QQQ was at a 52-week high, subsequent drawdowns in the intermediate-term have been well above average.
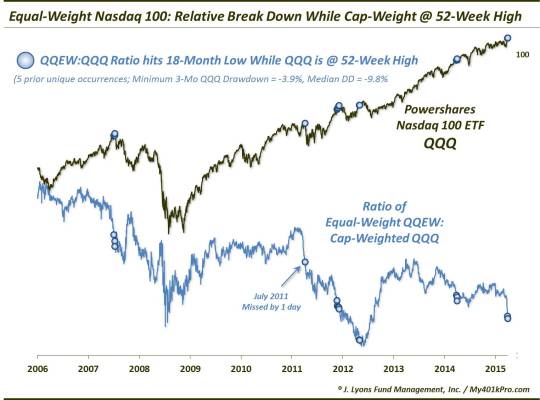
As the above chart notes, since the inception of the QQEW in 2006, this combination of conditions has resulted in a median 3-month drawdown in the QQQ of -9.8%. Even the minimum 3-month drawdown following the occurrences of -3.9% was greater than the median drawdown following all days of -3.6%. Here are the months in which these events occurred:
- October 2007
- July 2011 (actually missed by just 1 day, but conditions were similar enough to warrant inclusion in our view)
- March 2012
- August 2012
- July 2014
- July 2015
Thus far, the relatively few still-strong segments of the market have been able to prop up the major averages, masking some serious deterioration in the broader market. A break down of those strong areas would further weaken the already fragile support, leaving the market vulnerable to a serious correction. Today, we are seeing the kind of negative impact that just one leader (AAPL) can have on the market once it weakens. If we see many more leaders begin to break down, the resulting correction could feel like a 500-pound weight to the chest of investors.
_____________
“Bench Press” photo from this YouTube video (he was OK)
More from Dana Lyons, JLFMI and My401kPro.
The commentary included in this blog is provided for informational purposes only. It does not constitute a recommendation to invest in any specific investment product or service. Proper due diligence should be performed before investing in any investment vehicle. There is a risk of loss involved in all investments.


