Wild Shanghai Express Makes An Important Stop
Without a doubt, the stock market of the year over the past 12 months has been China’s Shanghai Composite (SSEC). From June 30, 2014 to June 30, 2015, the SSEC was up a staggering +109%. And that takes into consideration the relative bloodbath dealt to the SSEC during the past 2 weeks, during which time it lost as much as 24%. This correction has heightened the China “bubble” talk among investment circles, which was already at a feverish level before the selloff. Taking a step back from the dueling conjecture over whether the Chinese market is a budding opportunity or a bubbly time bomb, the chart of the SSEC shows orderly, but wild, price action.
What do we mean by that oxymoron of a statement? Well, just over a year ago, we published this chart of the Shanghai Composite noting its historically low volatility at the time:
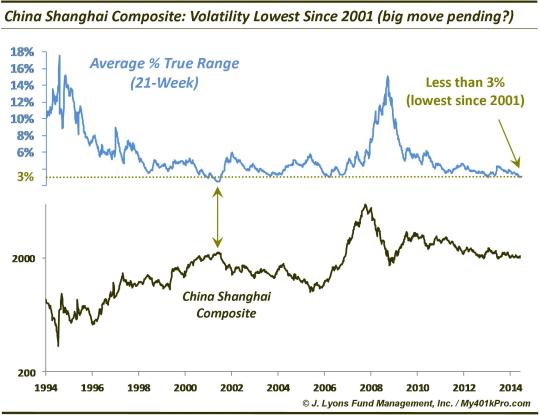
As the chart illustrates, the SSEC’s % Average True Range (essentially, the largest of the distance from high to low or from the previous close to the high or low divided by the close) at the time on a 21-week basis was less than 3%. That was the 2nd smallest in the SSEC’s history and had us opining whether a “big move was pending?” Well, all back-slapping aside, even we could not have envisioned the 100%+ gain over the next 12 months.
Fast-forward to today and it is a different story. Currently, the 21-day % ATR on the Shanghai Composite is at 5%! Again – that is on a daily basis! For reference, the 21-day ATR last July was less than 1%. This 5% range is something that was only seen in the after-math of the 2007-2008 bubble.
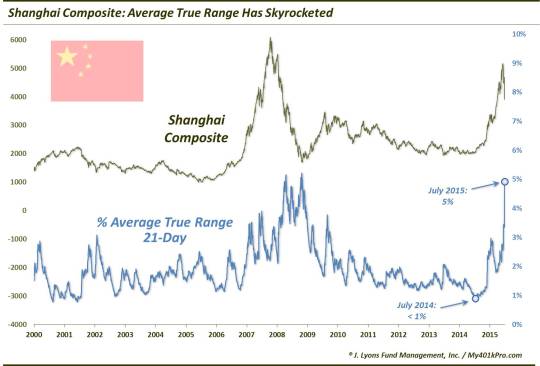
This jump in volatility is certainly a concern. Not only because of what happened the last time the index’s ATR got this high, but the mere size of the price swings naturally adds risk to investing – or trading – in Chinese securities.
That said, there is one piece of comforting evidence perhaps suggesting the index is not necessarily in an out-of-control free-fall situation. Looking at the chart of the Shanghai Composite, despite the tumult over the past 2 weeks, the index has held a major level of indicated support over the past several days. Now that may change by tonight, who knows. However, the fact that an index which is currently swinging by 5% a day is conforming to a chart level that it “should” (so far) is an indication that there is still orderly trading afoot.
Here is the level we are talking about.
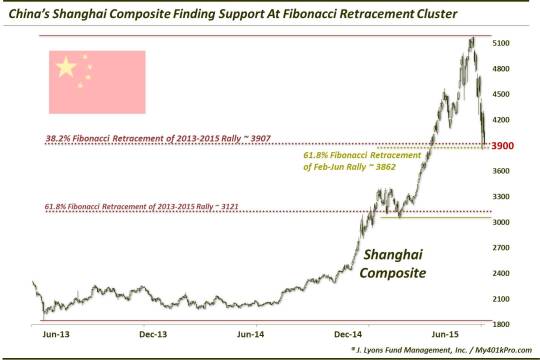
As the chart shows, 2 key Fibonacci Retracement levels line up in close proximity to the 3900 level:
- The 38.2% Fibonacci Retracement of the 2013-2015 Rally is ~3907
- The 61.8% Fibonacci Retracement of the February-June Rally is ~3862
Take note that the lows over the past 4 days of wild action in the SSEC were 3875, 3848, 4044 and 3911. These lows were right in the vicinity of the key Fibonacci Retracement cluster and suggest that, for now, the index is trading in an orderly, though wide, manner. Importantly, if the index can continue to successfully hold this 3900 level, it has a chance to move higher and, perhaps, commence a new up-leg. Should it fail here, the next level of major support would not come in until perhaps near the 3100 area.
There is no doubt that the trading in the Shanghai Composite has been wild. It is certainly not for the faint of heart. And maybe it is another bubble in the process of popping. However, up until this point, it has held its most important line of support. This is an indication that A) it has a chance to bounce from this support area and B) the selloff, while wild, is still somewhat orderly.
Stay tuned – it’s always exciting on the Shanghai Express.
_____________
Photo of “Shanghai Express” movie poster from 1932.
More from Dana Lyons, JLFMI and My401kPro.
The commentary included in this blog is provided for informational purposes only. It does not constitute a recommendation to invest in any specific investment product or service. Proper due diligence should be performed before investing in any investment vehicle. There is a risk of loss involved in all investments.