Volatility Of Volatility Flies Off The Charts

The Volatility Index of the VIX just crushed its previous record high.
We’ve spent the week pointing out some of the eye-opening readings dished out by various metrics related to the stock market in recent days (what else would we be discussing?). The volatility has truly been of a historic level. Speaking of volatility, perhaps the single best data point in illustrating the extremity of the market’s behavior comes from the volatility market. Most market observers by now are familiar with the VIX, which is a measure of the expectations of volatility on the S&P 500. Well, there are now volatility indexes on a multitude of market indicators and securities. This includes the VIX itself – yes, volatility expectations of volatility.
On Monday, this indicator, called the VVIX, literally flew off the charts, setting a new record high by a mile.
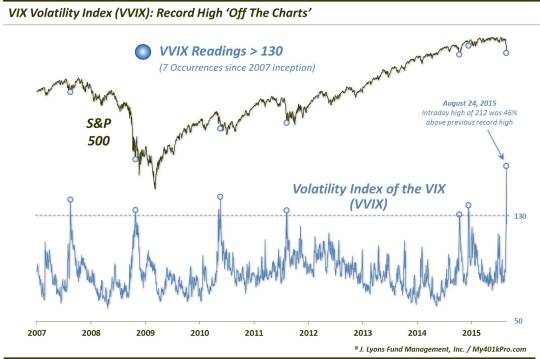
Monday’s closing price on the VVIX of 168.75 was 17% above the previous high close since its inception in 2007. Furthermore, its intraday high of 212.22 was a full 46% above the previous high close. If that doesn’t instruct one of the historic nature of the recent selloff, I’m not sure what will.
So what now? Admittedly, this post falls largely into the category of “trivia”. Even if we had been able to post it on Monday or Tuesday (we couldn’t post everything we wanted to), we’re not sure how helpful it would have been. However, looking at prior extreme high readings may or may not aid us in navigating this market.
Historically, there have been 6 unique readings above 130, prior to this one. Here is how the basic setup looked at each instance in the S&P 500:
- August 2007: S&P 500 off 9% from its high – led to untested low
- October 2008: S&P 500 off 35% from its high – led to further losses over the next month
- May 2010: S&P 500 off 12% from its high – led to further losses over the next 6 weeks
- August 2011: S&P 500 off 17% from its high – led to tests and further losses over the next 2 months
- October 2014: S&P 500 off 7% from its high – led to untested low
- December 2014: S&P 500 off 4% from its high – led to untested low
- August 2015: S&P 500 off 11% from its high – ??
We’re not sure how much this look helps in figuring the odds of a V-type rebound versus eventual retests and possibly new lows. In the prior instances, the 3 more violent declines (down 12%-35%) led to a series of tests and eventual further losses. The 3 more mild cases (down 4%-9%) led to an immediate low that would not be tested.
Perhaps unfortunately, the current instance, at -11% on Monday, falls smack dab in the middle of the 2 sample groups. So, it may be up to one’s interpretation regarding the proper group of precedents in which to place the current event. (FWIW, we would opt for the former, “violent” group). Then again, this analysis may have no bearing whatsoever on the future path of stocks.
Months from now, we may look back on this post and say it really wasn’t helpful or instructive at all. However, the “off-the-charts” record volatility of volatility is still the best symbol we’ve seen yet of the recent, historic selloff.
______
“Water (Explored)” photo by johanlundahl.
More from Dana Lyons, JLFMI and My401kPro.
The commentary included in this blog is provided for informational purposes only. It does not constitute a recommendation to invest in any specific investment product or service. Proper due diligence should be performed before investing in any investment vehicle. There is a risk of loss involved in all investments.

