Brazilian Bovespa: The Most Interesting Chart In The World
I’m not sure if the guy in the Dos Equis commercial is Brazilian, but it would be fitting if he was because, in our view, the Brazilian Bovespa is…”The Most Interesting Chart In The World” right now. That is obviously saying a lot too considering the present action within the financial markets. So what is our criteria for that title? It’s obviously subjective, but lots of potential “GOOD” and potential “BAD” certainly makes for an interesting chart. The Bovespa has that.
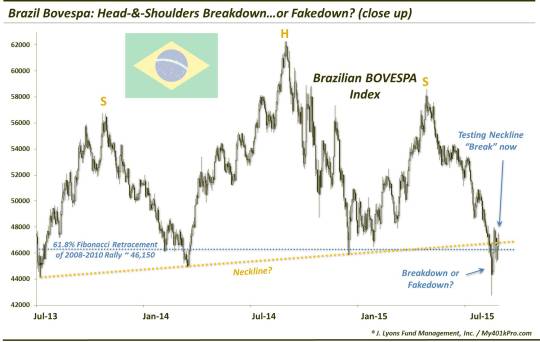
We have been following the Bovespa (Brazil’s main stock index) closely for several years now. The reason it popped up on our radar in mid-2013 was because it was testing a very crucial line of potential support: the 61.8% Fibonacci Retracement of its 2008-2010 rally around 46,150. It held that level successfully (GOOD), producing a solid 25% bounce.
In early 2014, we were not surprised to see the index return to, in our mind, likely “test” the 61.8% level. It held successfully again (GOOD), producing an even bigger bounce that both eclipsed the previous bounce high and also broke the Down trendline from the 2010 peak (VERY GOOD). At that point, we thought the Bovespa stood a good chance of launching the next leg up in its ongoing secular bull market.
Then BAD stuff happened. After climbing some 40%, the index lost its entire gain…returning, once again, to the 61.8% line (BAD). That left a series of 3 lows near the 46,150 area. And we all know how “triple bottom” theories tend to work out (i.e., NOT GOOD). Lo and behold, however, the Bovespa managed to bounce again, by roughly 25%. That was GOOD AND BAD. GOOD that it rallied, BAD in terms of where it stopped. Once the index began to retrace its latest bounce, a dreaded, bearish chart pattern began to reveal itself. After a full retracement by mid-August of the latest rally, the Bovespa was left with two 25% rally peaks sandwiching the 40% rally peak, i.e., a massive potential head-&-shoulders pattern (VERY BAD). The series of lows from 2013 formed the key potential “neckline” of the pattern.
Now it could be argued that the post-2013 series of lows merely represents a substantial base forming that will eventually propel the index much higher (GOOD). The key lay in the reaction of the Bovespa at the 61.8% Fibonacci Retracement level. If it held, the upside out of the base was substantial (GOOD); if it broke, the repercussions of the head-&-shoulders break (and the Fibonacci break) would be immense (BAD).
During the August 24 mini-crash, we thought we had our answer as the Bovespa dropped some 6% intraday, closing well below the neckline and Fibonacci line. However, as all market technicians know (especially in recent years), it is not the break but the sustaining of the break that matters. And over the next 3 days, the index recovered all the way back to test the neckline/Fib line again. A week later, that is where the Bovespa still finds itself.
Here is the chart:
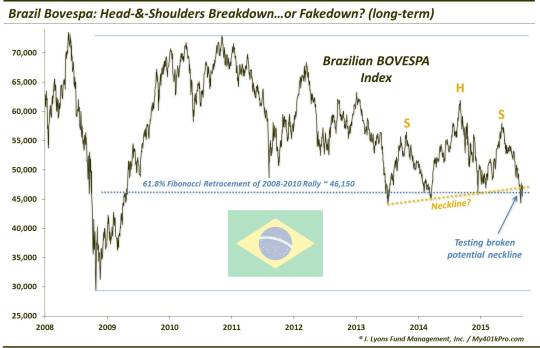
And a closer look at the pattern since 2013:
Again, why is this so interesting? Because of the massive potential movement of the index – in either direction. I’ve been asked by several people my opinion of the Brazilian market. This is what I’ve been telling them: “I’m confident it is going to move BIG…I just don’t know which way yet.”
In a nutshell: if the Bovespa fails in its attempt to recover the head-&-shoulders neckline (BAD), it has substantial downside. Not just due to the h-&-s pattern, but the break of the Fibonacci support line that has held it for the past 2 years would be significant. How much downside would the index be subjected to? Well, based just on the breakdown of the head-&-shoulders pattern, a measured move would suggest a drop all the way down to near the 2008 lows. And considering the similar full retracements among various commodity and emerging markets that are highly correlated with Brazil, that outcome is entirely conceivable.
On the other hand, what if the Bovespa recovers the neckline successfully (GOOD)? Well, a false breakdown could be just as positive as a breakdown is negative. And assuming the level holds, a substantial bounce could materialize from it. And given that the recovery would mean another “hold” of the 61.8% Fibonacci Retracement level of the 2008-2010 rally, an eventual new up-leg to the post-2002 secular bull market could conceivably unfold…i.e., new all-time highs.
So which will it be? Well, like the guy in the commercial, this chart is unpredictable. All we can say is the Brazilian Bovespa is primed to move BIG – we just don’t know which way yet. But it should be interesting.
_______
More from Dana Lyons, JLFMI and My401kPro.
The commentary included in this blog is provided for informational purposes only. It does not constitute a recommendation to invest in any specific investment product or service. Proper due diligence should be performed before investing in any investment vehicle. There is a risk of loss involved in all investments.