European Equities Are On The Ropes

Equity indices across Europe are presently testing critical support levels.
Back in June, we wrote several posts indicating the potential for European equity markets to begin a new up leg in their bull runs that began impressively early in the year
(including this post on June 10 related to the Dow Jones STOXX 50 Europe Index). This stance was predicated on A) the potential magnitude of the January breakout in most of the European markets and B) the fact that most markets were pulling back to a level that we identified as significant potential support.
Well, we were dead-on regarding the levels. All across the continent, markets bounce almost precisely off of the area we identified. However, it is looking like we were probably dead wrong on a significant new up leg beginning for the European markets. For the indices could only mount a short-term bounce, in the vicinity of 10%-12% in most markets. Importantly, though, the April highs could not be overcome. At the moment, European equities are in the throes of a major test of perhaps the health of even the post-2009 bull market.
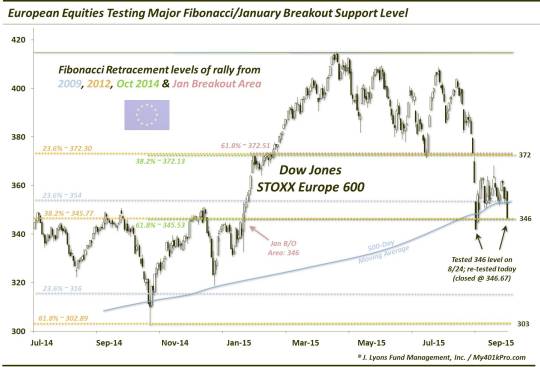
To review, in June we laid out the basis for our belief in a potential bounce for European stocks. The main source of potential support on the charts was a cluster of Fibonacci Retracements from major lows to the European highs in April. To use the Dow Jones STOXX European 600 as an example, here were the Fibonacci levels that were closely aligned as potential support.
- 23.6% Fibonacci Retracement of the 2012-2015 Rally ~372.30
- 38.2% Fibonacci Retracement of the October-April Rally ~372.13
- 61.8% Fibonacci Retracement of the post-January Breakout Rally ~372.51
As mentioned, most European markets bounced close to the levels we identified. The STOXX 600 was no exception, bottoming on July 7 at 372.74. As indicated, though, while the index bounced 10% off that level, it could not overtake the previous highs. During the global equity rout in late August, the STOXX 600 broke below its 372 lows.
We mentioned in all of the posts that a break of that initial Fibonacci Retracement cluster opened the downside to the subsequent cluster lower. As it happens (though, not surprisingly), the Fibonacci levels lined up closely with the January breakout levels on most indices. On the STOXX 600, that level was around 346:
- 38.2% Fibonacci Retracement of the 2012-2015 Rally ~345.77
- 61.8% Fibonacci Retracement of the October-April Rally ~345.53
Also…
- January Breakout Level ~346
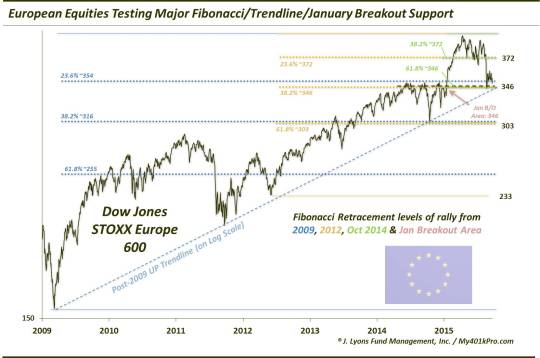
- 23.6% Fibonacci Retracement of the 2009-2015 Rally ~354
- Post-2009 UP Trendline (on a log scale)
In the late August mini-crash, the index temporarily breached that level before bouncing. After a few weeks of a meager bounce, the STOXX 600 has entered full-fledged re-test mode, closing today at 346.67.
On a long-term perspective, you can see the post-2009 UP trendline being tested as well.
So what does this mean…and what’s going to happen? We don’t have a crystal ball so we’ll just play it like we did in June-July. If the index can hold this level near 346
(or quickly recover it should it break temporarily), it certainly has the potential to mount a significant bounce. Furthermore, it is not uncommon for an index to test a breakout level so the full retracement of the post-January move is not a death sentence for European stocks. However, as we stated in various posts in June, it would have indicated a better show of momentum had the 372 level held and supported a move to a new high. Given that, there is now a glaring lower high on the charts of European markets.
Should the 346 level fail to hold, it would signify a host of meaningful charting events…none of them positive. It would break the post-2009 UP trendline, putting doubt into the sustainability of that bull market. It would signify a complete failure of the breakout in January. And it would bring the next Fibonacci level into play near 303 (~12% downside). That area also marks the October 2014 low. At that point, the market is in jeopardy of also setting a lower low. Lower highs and lower lows are the definition of a downtrend.
Thus, the importance of holding the current levels in the Dow Jones STOXX Europe 600 probably cannot be overstated. And the same goes for most markets across Europe. One concern is that the German DAX appears to have already broken its “line of demarcation” near 9900. Obviously, the German market is the most important as it does the most heavy lifting for the continent. That said, the more popular the index or security, the more open it is to “gaming the charts” on the part of professionals, human and android alike. Therefore, the potential exists there for a false breakdown (perhaps Mr. Draghi can whip up some more “whatever it takes”). Regardless, we would judge each market and index on their own merits.
While investors (or more likely, traders) often agonize over each and every tick of a market, there are undoubtedly some junctures that are more critical than others. European equities appear to be at such a juncture presently.
________
More from Dana Lyons, JLFMI and My401kPro.
The commentary included in this blog is provided for informational purposes only. It does not constitute a recommendation to invest in any specific investment product or service. Proper due diligence should be performed before investing in any investment vehicle. There is a risk of loss involved in all investments.