Global Equity Index Hanging On Lower Precipice

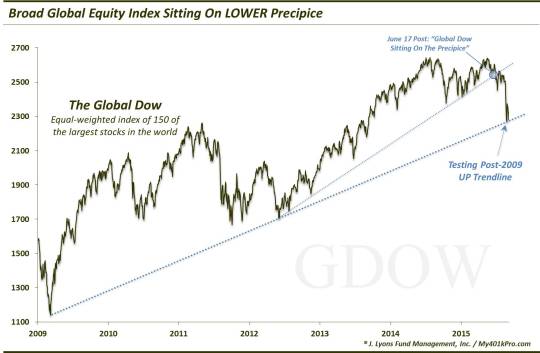
On June 17, our Chart Of The Day indicated that the Global Dow Index was “sitting on the precipice”. The Global Dow is an equally-weighted index of the world’s 150 largest stocks. Therefore, it is a pretty fair barometer of the state of the global equity market. The precipice at the time was the UP trendline connecting the 2012, 2014 and 2015 lows. In that post, we intimated that the trendline stood a good chance of being broken sooner than later. As we stated:
one reason why a breakdown may come sooner than later is the frequency of the trendline touches recently. As the duration between touches of a trendline or support/resistance line decreases, the odds of a break increase. Therefore, it would not surprise us to see a breakdown sometime soon.
Indeed, after bouncing off the trendline the very next day, the index would revisit the line just 7 days later. It did not fare as well that time as it broke down through the trendline and immediately dropped some 4%. That immediate drop validated the trendline as a significant level, as did the failed attempt to retake the trendline just a few weeks later. The failure of that level precipitated (<– see what we did there?) a further drop of some 13% over the following month as global equity markets around the globe saw steep declines.
That decline brought the Global Dow down to one of the support areas we indicated in that June post around 2280. And while that level was based on key Fibonacci analysis, another major source of support happened to be intersecting that same level: the post-2009 UP trendline. The Global Dow has been able to hold that level, thus far, though it has not yet been able to mount much of a bounce.

As precipices go, this one would be even more painful in the event of a breakdown considering it would be a chink in the armor of the entire cyclical bull market. That is not to say that a breakdown below the post-2009 UP trendline would signal the end of the cyclical bull market, but it would necessarily mark a not insignificant loss of momentum.
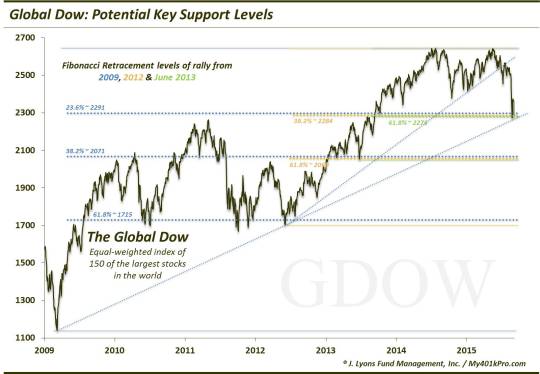
Speaking of breaks, what levels would a break of the trendline open up on the downside? Updating another chart we posted in the June piece provides some possible levels.

As the chart indicates, the post-2009 UP trendline currently resides in the same area as a very important confluence of Fibonacci Retracement levels:
- The 23.6% Fibonacci Retracement of the 2009-2014 Rally ~2291
- The 38.2% Fibonacci Retracement of the 2011-2014 Rally ~2284
- The 61.8% Fibonacci Retracement of the June 2013-2014 Rally ~2275
Add in the 1000-day simple moving average and it’s not hard to see why the index found support where it did. Should the Global Dow fail to hang on the precipice here, the next major level of logical support would come in at the next sequence of Fibonacci Retracement levels in the 2050-2070 area, or another 10% lower.
Now, to some, the word “precipice” may connote the sense that a breakdown is inevitable. That is not our intention. It is possible to rise up from the precipice and, in fact, that would not be surprising to see considering the importance of the current levels. An immediate failure here would suggest some sort of global crash is truly at hand. That would not be our “highest odds” scenario. Thus, one’s focus at this time may center on the magnitude and sustainability of a bounce from here. A “dead cat” bounce should take the index to perhaps 2420 (+6%) at the worst, and maybe 2500 (+10%) at best. From there, another test of the precipice here at 2280 would not be surprising.
Of course, this entire scenario is speculation and conjecture. The point is that this key barometer of global equities dropped to a level that it could ill-afford to lose. And while a bounce should transpire from here, the fact that the index has been traversing this level for the past 8 days reminds us that significant potential risk awaits should it fall off the precipice.
________
“World on knife edge” photo by ChazGoes.
More from Dana Lyons, JLFMI and My401kPro.
The commentary included in this blog is provided for informational purposes only. It does not constitute a recommendation to invest in any specific investment product or service. Proper due diligence should be performed before investing in any investment vehicle. There is a risk of loss involved in all investments.


