Is The Flurry Of 90% UP Days An “All Clear” Signal?

“Thrust Days” are said to be good markers of a stock market launch…are they?
The other day, we looked at the recent spate of 90% Down Volume Days on the NYSE. Traditionally, these days, in which 90% of the volume on the exchange is in declining stocks, are supposed signs of washouts, or a capitulatory rush for the exits. Therefore, they are said to occur often near market lows. Well, we took a look at this phenomenon and came to the conclusion that, yes, there was some evidence backing up the rosy rebound theories. This has been particularly true when witnessing a pair of such 90% Down Days in a short period of time. In our post the other day, however, we discovered that the presence of more than 2 of these days in a short span did not expand upon the good results. Rather, at that point, the flurry of 90% Down Days was more a signal of a bad market than an impending low, i.e., it was too much of a good thing.
Today, we take a crack at the recent flurry of 90% UP Volume Days. Somehow, these too are supposed to be “good news” for the market as well (I guess the bulls run the Wall Street cliche department). The theory is that the 90% UP Day, or “Thrust Day” is a sign of rampant demand returning to the market (particularly when following a 90% Down Day). So how about this one…any evidence to support it?
We took a look at the topic from a few angles. First, we noted the recent flurry of such 90% UP Volume Days – 3 in the past 2 weeks to be exact – from a historical perspective. As it turns out, since 1965, this recent flurry is the 18th such occurrence (only counting unique instances, not successive cases). However, 17 of them have occurred since 2007. Just one occurred in the 42 years prior. That was in August of 1984.
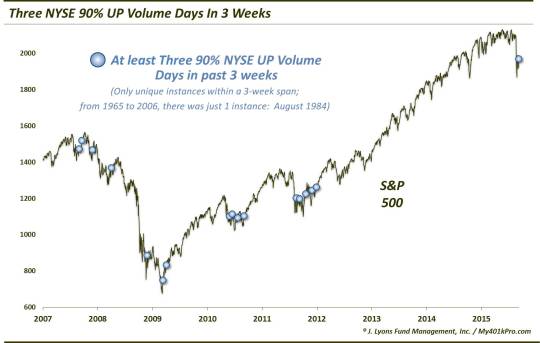
So how were the results? Were these thrust days truly suggestive of a market launch? Well, one look at the chart and you can probably gather that whatever launches took place as a result of these days, the launch sequences were rather lengthy. That is because these flurries tended to come in flurries themselves, rather than one quick, timely trigger. And like the 90% DOWN Day flurries, these have tended to show up in bad markets, at worst, and bottoming markets, at best. And again, they have had a tendency to show up both early and late in the bottoming process. Therefore, returns and consistency of returns following these signals in the shorter-term are nothing like those that “launch theorists” would have you believe.
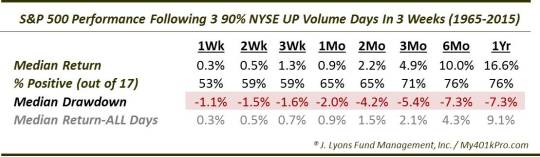
While the returns are not bad, they are nothing to write home about in the short-term. You really have to go out to 3 months to find solid out-performance. And even then, the elevated drawdowns suggest a rocky road to get to those favorable intermediate to longer-term results.
The other angle we looked at was in the context of the post-crash study we did last week. To refresh, the majority of market “crashes” have led to a bottoming type of pattern. And the majority of those bottom patterns have eventually led to some sort of retest of the initial crash low. Our question was whether the 90% UP Days were signaling that the worst was behind and it was all clear for the market – or whether it would continue to conform to the traditional retest pattern. Therefore, we looked at past post-crash periods for evidence of 90% UP Days and their effects on the pattern.
As it turns out, of the 8 similar crashes, 5 of the post-crash periods experienced at least one 90% UP Volume Day within the context of the bottoming pattern. These 5 instances (comprising 11 total 90% UP Days), therefore, continued along the bottoming/retest path, undeterred by the 90% UP Days.
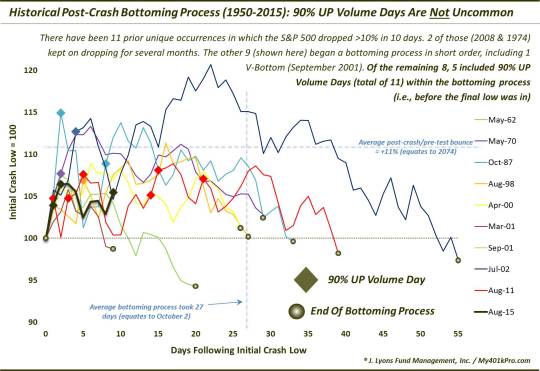
Therefore, with respect to this chart, the 90% UP Days do not indicate any type of a “launch” that would provide escape velocity out of the ongoing bottoming pattern. And regarding the top chart, the rash of 90% UP Days does not necessarily indicate a impending launch either. Rather, it is more of an indication of the highly volatile market that continues to dominate. Thus, we would not be surprised to see even more 90% UP (and DOWN) Days before a resolution to this post-crash bottoming pattern.
Therefore, our thought process, as it pertains to this particular signal, is that any potential stock market launch remains on hold for the time being.
________
“Rocket Chimp” photo by Chetham’s Library.
More from Dana Lyons, JLFMI and My401kPro.
The commentary included in this blog is provided for informational purposes only. It does not constitute a recommendation to invest in any specific investment product or service. Proper due diligence should be performed before investing in any investment vehicle. There is a risk of loss involved in all investments.

