Materials Stocks Testing Critical Level

On July 31, we posted a piece suggesting that the basic materials sector was threatening a material breakdown. Our rationale was the proximity of the Dow Jones U.S. Basic Materials Index to a confluence of key Fibonacci Retracement levels. As we have mentioned before these levels reflect the market’s tendency to “retrace” market moves in similar increments. We have also mentioned before that, in our view, the strongest Fibonacci signals come when there is a confluence of various such levels in the same vicinity. This was, and is, the case on the chart of the materials index. Oh, and that “material” breakdown did come to pass.
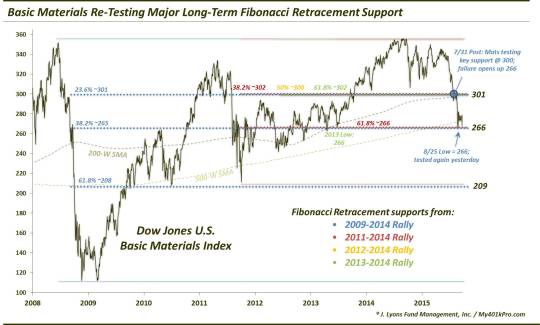
That breakdown on the
Dow Jones U.S. Basic Materials Index occurred at around the 300 level. Note how the following 4 Fibonacci Retracements drawn from key lows in 2009, 2011, 2012 and 2013 to the 2014 highs, aligned almost perfectly with each other in that level:
- 23.6% Fibonacci Retracement of the 2009-2014 Rally ~301
- 38.2% Fibonacci Retracement of the 2011-2014 Rally ~302
- 50% Fibonacci Retracement of the 2012-2014 Rally ~300
- 61.8% Fibonacci Retracement of the 2013-2014 Rally ~302
- Additionally, the 1000-Day (or 200-Week) Simple Moving Average is right in the vicinity as well.
We noted in that July post that:
Should the Fibonacci Retracement cluster around 300 fail to hold the index up, here is the next set of Fibonacci levels that the index would be likely to test (near 266, or 11% lower):
In the August mini-crash, the Dow Jones U.S. Basic Materials Index hit a closing low of…266. After bouncing for a few weeks, the index is once again testing that level.
Here’s a close-up look at the recent action.
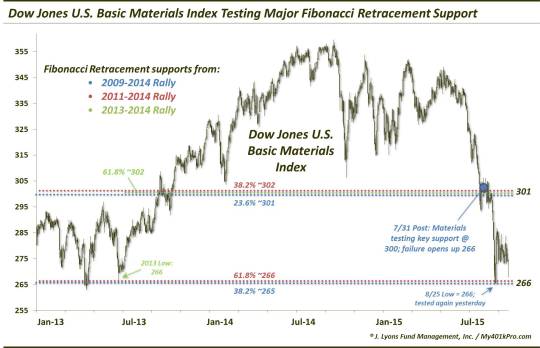
That set of Fibonacci and other significant levels around the 266 area are the following:
- 38.2% Fibonacci Retracement of the 2009-2014 Rally ~265
- 61.8% Fibonacci Retracement of the 2011-2014 Rally ~266
- 2013 Lows ~266
- Additionally, the 500-Week Simple Moving Average is right in that vicinity as well.
Should the
Dow Jones U.S. Basic Materials Index
bounce off the 266 area, its first big challenge may come at the post-crash bounce highs near 286. After that, it would be the 300 area. The problem for this index is, every potential line or indicator of support on the way down is now going to act as resistance on the way up. So even if the 266 level holds for now, the index would still have its work cut out for the foreseeable future.
Should this 266 level give way, there is really no noticeable, solid support until the 2011 lows which would correspond with the 61.8% Fibonacci Retracement of the 2009-2014 bull market. That level is around 210, which would signify a loss of over 20% from current prices. That’s on an index that is already off 25% from its highs. Not good.
We ended the July post by saying:
…if the (300) level fails, the Dow Jones U.S. Basic Materials Index is likely to visit the next cluster of Fibonacci Retracement levels near 266. Would such a move be a byproduct of an acceleration of the global deflationary trend currently in place? Or would it be a catalyst for a broader market decline? That is yet to be determined. However, such a breakdown would not be welcomed news for a stock market that has already seen its share of bricks removed from the wall.
Well, that dire scenario played out, in the basic materials sector and in the broader market. A failure of the current key support area would signify a deepening of these problematic trends that have unfolded over the past month. And as bad as things have been this past month, a further acceleration could be devastating.
________
More from Dana Lyons, JLFMI and My401kPro.
The commentary included in this blog is provided for informational purposes only. It does not constitute a recommendation to invest in any specific investment product or service. Proper due diligence should be performed before investing in any investment vehicle. There is a risk of loss involved in all investments.