A Material Strategy Shift (PREMIUM-UNLOCKED)
The following post was originally issued to TLS members on 12/10/2019.
Following another successful “BTD”, what are our next moves?
As TLS members know, our strategy of late — actually, nearly the entire year — has been one focused on Buying The Dips, aka, BTD. One week ago, we recommended doing just that as equity markets were in the throes of a “dip”. As you know, that move has paid off handsomely (again) as stocks have essentially shot straight up since then. So what now?
As we loathe chasing prices higher we are mostly just sitting with the positions that we have until A) our risk assessment changes or B) chart action dictates we either add more exposure or pocket some profits. However, for those looking to add more exposure now, we are seeing a few potential near-term opportunities in areas that are not yet extended like some of our faves, e.g., technology and health care, are.
In recent weeks, we have seen a catch-up attempt on the part of prior laggards like small caps and other broad market measures. And while those areas are still not on our preferred long list (we prefer longer-lasting relative strength), we did flag them as having near-term out-performance, or catch-up, potential prior to their recent burst. And that’s “flag” as in bull flag (by the way, that explains our including the bull and flag in the image above). Our identification of the bull flags on the near-term charts gave us a head’s up on the ensuing rotation into and out-performance among the small-caps and broader indices.
So what other laggards may be flagging potential rotation or out-performance about to come their way? Here are a couple areas we are looking at while we wait for our core longer-term relative strength positions to present their next favorable entry points:
For one, the materials sector may be constructing a favorable near-term long setup (explains our use of “material” in the title — have to throw non- members off our scent). After lagging for at least 6 months, this sector is setting up a potential near-term bull flag and a potential bout of near-term out-performance. This view is bolstered by action in the commodity complex where key indices also appear to be bull-flagging ahead of a potential short-term burst. As you know, we are not commodity bulls in the longer-term. However, near-term prospects look promising in indices like the CRB Index and the TR Equal-Weight Commodity Index.
- Specifically, the Materials SPDR (XLB) recently broke key resistance and is now bull-flagging just above the breakout level — potentially setting up the next up-leg. As far as an entry point, anywhere nearby is fine ahead of a potential breakout above 60.80…but the ideal entry would be between 58.62-59.45.
- Additionally, the iShares Basic Materials ETF (IYM) is bull-flagging just below key resistance ~97. And while this remains resistance, it stands a good chance at breaking out above there, which could bring even stronger near-term out-performance in this one. As far as an entry point, again, anywhere nearby is fine ahead of a potential breakout above 97…but the ideal entry would be between 92.50-94.50
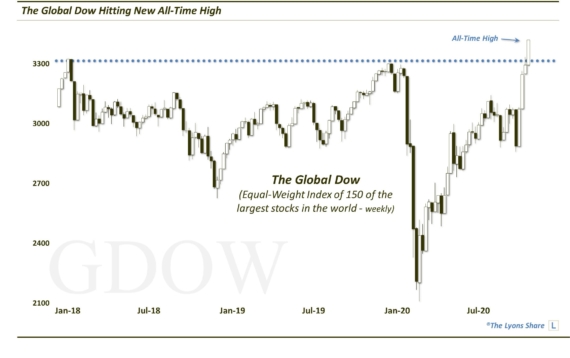
Another area that has lagged in the longer-term but is potentially setting up nicely in the near-term is the broad international equity market. Indices like the MSCI EAFE and the Global Dow are still well below their 2018 peaks and, thus, off our relative strength radar. However, near-term, they too are setting up potential out-performing rallies. In fact, the way these 2 indices have tightly consolidated recent rallies just below resistance has been a thing of technical beauty. Like the materials, these international markets represent good potential near-term rotational out-performance opportunities.
- Specifically, the iShares EAFE ETF (EFA) is bull-flagging just below key resistance ~68.70. And while this remains resistance, it stands a good chance at breaking out above there, which could lead to strong near-term out-performance. As far as an entry point, anywhere nearby is fine ahead of a potential breakout above 68.70…but the ideal entry would be between 67.67-68.07.
- Additionally, the Global Dow SPDR (DGT) is also bull-flagging just below key resistance ~87.75. It too stands a good chance at breaking out above there, which could bring near-term out-performance as well. As far as an entry point, again, anywhere nearby is fine ahead of a potential breakout above 87.75…but the ideal entry would be between 86-86.75.
While these market segments are still lagging in the longer-term, the near-term chart patterns are pointing to potential out-performance in the near-term (Taiwan/EWT is another one with a tight near-term setup, though, it is a bit more extended). Thus, for those looking to add some long equity exposure nearby, these funds may represent a more attractive near-term option than some of those higher relative strength areas that have already run a lot.
If you’d like to see these charts as they come out in real-time, follow us on Twitter and StockTwits. And if you’re interested in the daily “all-access” version of all our charts and research, please check out our site, The Lyons Share. You can follow our investment process and posture every day — including insights into what we’re looking to buy and sell and when. Plus, we’re holding our Holiday Sale right now with Annual Memberships at 20% OFF — so it’s a perfect time to sign up! Thanks for reading!
_____________
Disclaimer: JLFMI’s actual investment decisions are based on our proprietary models. The conclusions based on the study in this letter may or may not be consistent with JLFMI’s actual investment posture at any given time. Additionally, the commentary provided here is for informational purposes only and should not be taken as a recommendation to invest in any specific securities or according to any specific methodologies. Proper due diligence should be performed before investing in any investment vehicle. There is a risk of loss involved in all investments.


