Speculators Make Record Bet On Volatility Rise

Non-Commercial Speculators are net long more VIX futures contracts than ever before.
We’ve discussed on several occasions using the CFTC’s “Commitment Of Traders” report as a gauge of sentiment within a certain market. To refresh, the CFTC tracks the net positioning of various groups of traders in the futures market in the COT report. One such group is called Commercial Hedgers. As their name implies, their main function in the futures market is to hedge. On the other side of the ledger – and normally with a mirror image position – is the Non-Commercial Speculator group. These Speculators are typically funds engaged in, you guessed it, speculating.
Speculators’ positions tend to follow prices while Hedgers’ positions generally move in the opposite direction. Thus, it is almost always the case that Speculators will be incorrectly positioned – and to an extreme – at major turning points in a market. Thus, on a contrarian basis, investors may theoretically profit by fading those Speculator extremes. On the surface, such an extreme appears to be in place in the VIX futures market.
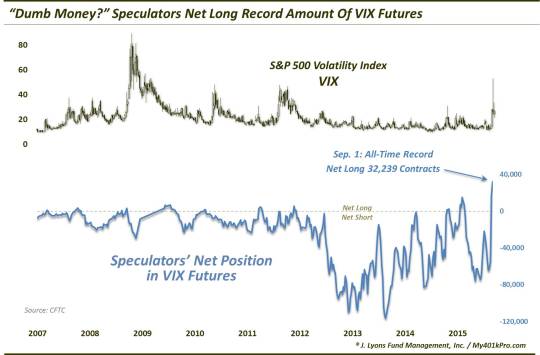
As of last week’s COT report, Speculators were net long the largest number of VIX futures in the history of the contract.

According to the COT data, Speculators reached a net long position of +32,239 contracts, essentially doubling the previous record set in early February. Superficially, what it says is that since the inception of the VIX futures contract in 2004, Speculators have never before placed as big a bet on a rise in the VIX. Now it is always a tough task to determine when these positions are at an extreme – or at least to determine when the extreme will produce a turnaround in prices. An all-time record, however, is a pretty good start.
But…
Before folks go hog-wild contrarian bearish on the VIX (and bullish on equities) based on this record long Speculator position, there are a few possible caveats worth deliberating on.
First off, although this data is from the most recent COT report, it is nearly a week old by now. Furthermore, while it was published last Friday, it tracks the futures positioning as of the prior Tuesday, i.e., September 1. Now the market has generally gone sideways since then so perhaps the positions are roughly the same. However, there is no way to know whether these positions are still accurate, or at least in the same ballpark. If there is any market capable of wild swings from one week to the next, it’s the volatility market.
Secondly, the behavior of the COT positioning in VIX futures has completely changed in recent years. This is no doubt due to the proliferation and increasing popularity of volatility ETF’s, which access the futures market, either directly or indirectly. A simple glance at the chart will tell you that the volatile post-2012 period bears very little resemblance to the 2004-2011 regime.
The rise in demand for volatility ETF products has necessitated the increased liquidity in the VIX futures. Therefore, we are now seeing extremes in COT positions that are much greater, even multiples, of those seen prior to 2012. Thus, what was once considered extreme is now pedestrian. Now, the current Speculator net long position is still a record, even compared to readings in the post-2012 world. Therefore, we’re not going as far as to say this reading is irrelevant. We think it is relevant and, on the margin, a bearish data point for the VIX and a bullish data point for stocks.
What we are saying is that, in this new derivative-based ETF regime, we still don’t know exactly what the related metrics are capable of. While the current COT reading is a record, it could still get record-er…and by a lot. Consider the extreme positions we’ve pointed out over the past year in Crude Oil futures, Dollar futures, etc., that have gone well beyond prior “normal” bounds. Or simply look at the Speculator net short position in this VIX contract starting in 2012. After a pretty reliable floor in the -20,000 range for nearly a decade, the Speculator net short position exploded in 2012, nearly moving 100,000 contracts beyond that level by 2013.
We just don’t know how this dynamic is ultimately going to play out – and I don’t think we will for many years.
______
“The Old Wooden Roller Coaster” photo by Moose Winans.
More from Dana Lyons, JLFMI and My401kPro.
The commentary included in this blog is provided for informational purposes only. It does not constitute a recommendation to invest in any specific investment product or service. Proper due diligence should be performed before investing in any investment vehicle. There is a risk of loss involved in all investments.

