IBM Investors Feeling Blue, But Major Potential Support Is Near

We seldom cover individual stocks in the blog. One exception was Wal-Mart, whose chart we analyzed a few weeks ago. WMT’s stock is trading at such a discount to where it was earlier in the year, it would make its marketing team salivate. Furthermore, the multiple layers of potential long-term support near current prices may be enough to make savvy investors salivate. As it happens, another stock with almost the exact same chart set-up as WMT is International Business Machines Corp. – IBM.
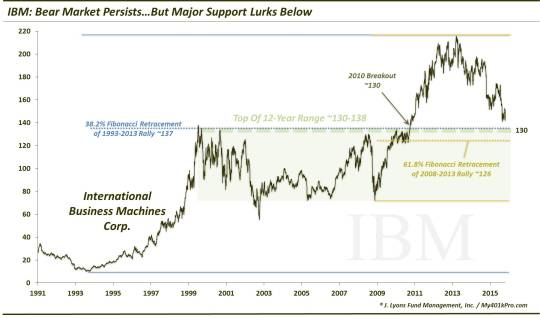
IBM’s stock spent about a dozen years, from 1998 to 2010, in a sideways trading range between roughly 70 and 140. In 2010, it sported a beautiful breakout above the range top from around the 130 level. The breakout propelled the stock higher for next 2.5 years to a high near 216 in 2013, a gain of roughly 65%. Since then, IBM, a.k.a., “Big Blue”, has taken a turn for the worse. Following yesterday’s suspect earnings and poor guidance, the stock traded today at a low of $140.27 per share, a new post-2013 low. However, things have gotten so bad that “knife-catching” support levels are fast approaching now.
Now we don’t attempt many knife catches in our practice, nor do we recommend the strategy. We prefer to buy funds that are in uptrends and displaying relative strength. That said, there are a select few major points on a chart that may offer a compelling risk:reward ratio when attempting to buy a security that is mired in a substantial decline. IBM, like we mentioned, may be approaching such a spot, based on a multitude of key chart analyses.
First off is the top of the former 12-year trading range. From 1999 to 2010, the stock made multiple peaks in the range of 127-139. Like mentioned above, in 2010 IBM finally did break out above those tops, launching it on a 65% rally into 2013. That launch spot occurred at roughly 130, making that price ground zero for the potential support zone.
In addition, there are 2 very significant Fibonacci Retracement levels in the vicinity, measured from the 2 most important lows in the last 35 years. These are arguably the most important Fibonacci lines on the entire IBM chart:
- The 38.2% Fibonacci Retracement of the 1993-2013 rally ~137
-
The 61.8% Fibonacci Retracement of the 2008-2013 rally ~126
As you can see, these lines again lie in the same vicinity as the former range top and breakout level. This tells us that there should be substantial support on IBM’s chart between 126 and 137.
Given the stock’s performance over the past few years, IBM investors (Mr. Buffet included) have been feeling downright blue. Yesterday’s earnings report dealt them another kick in the teeth. However, if they can withstand just a little more pain, the stock will be at levels near 130 that should provide staunch support based on a confluence of critical long-term chart factors. If Big Blue is going to finally reassert itself, that may be the area from which it begins.
_______________
“IBM” photo by Dan Farber.
More from Dana Lyons, JLFMI and My401kPro.
The commentary included in this blog is provided for informational purposes only. It does not constitute a recommendation to invest in any specific investment product or service. Proper due diligence should be performed before investing in any investment vehicle. There is a risk of loss involved in all investments.


