“Easy” Money Over For European Stocks?
After mounting a solid bounce off the September lows, European equity markets are now running into resistance.
First off, I placed the word “easy” in the post title in quotation marks because, as anyone who has participated in the financial markets for more than 10 minutes knows, making money is never “easy”. Secondly, I chose the photo because the Rodney Dangerfield comedy “Easy Money” is a funny movie. Moving on. We use the term “easy money” in markets when the price of the security or index has moved through an area of low resistance on a chart. For the Dow Jones European STOXX 600, this was the case from the September lows up until now, as there was little in the way of identifiable resistance on its chart (we are using the STOXX 600 as a European equity investment proxy as one cannot directly invest in the index).
Of course, the hard part is going long near the lows or at least somewhere along the way. It is also hard sometimes to stay long as prices chop up and down. After all, just because there is little in the way of resistance, it is no guarantee that prices will move all the way through the low-resistance area. For the STOXX 600, prices did indeed move all the way through such a zone, rewarding those smart, or lucky, enough to buy and stay in until now. That “easy” money is over now, though, as prices are bumping into multiples layers of resistance.
On the chart, we can see at least 3 significant levels of potential resistance in the vicinity of current prices near the mid-380′s:
- The breakdown level from mid-August
- The 61.8% Fibonacci Retracement of the post-April decline
- The 200-Day Simple Moving Average
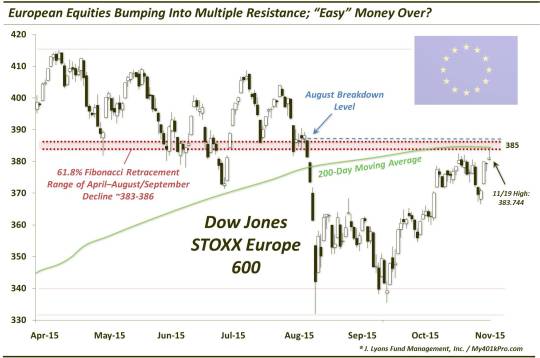
The area around 383-386 also marks the prior horizontal resistance that held from April until the August breakdown, save for about 4 days in July. Whether the gains of the past 6 weeks truly were “easy” or not, gains should get more difficult to come by from this point.
While the price structure of the past 2 weeks would argue for a bit more upside in the next few days, that would materialize within the meat of the considerable resistance we laid out above. Additionally, a slight overshoot closer to 390 would not be a surprise should it happen. It also would not be a slam dunk breakout as these slight break/fakeouts have become more the norm than the exception.
Zooming out a bit, let’s take a quick look at the bigger picture in the European stock market.
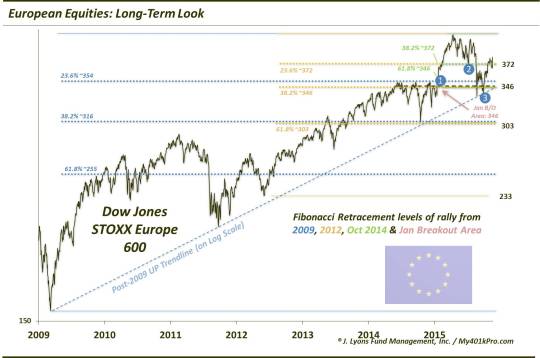
We have covered the region quite extensively this year due to some noteworthy developments. First of all, European bourses almost unanimously experienced a major breakout to all-time or multi-year highs in January (Point 1 on the chart January 20 Post: “European Equities Set To Blast Higher?”).
After rallying some 20% into April, it was time for a breather. On the subsequent pullback, we earmarked the first key support level based on Fibonacci Retracement levels back in June (Point 2 on the chart June 10 Post: “Charting A Course In European Stocks”). We surmised that the support area could provide a springboard to the next up-leg in European stocks, provided the April highs could be overtaken.
While European stocks were able to bounce some 11%, they could not surmount the previous peak. In the global equity carnage that ensued in August, the June-July lows were taken out, paving the way for a full-fledged test of the January breakout level. At the lows in late-August and again on a re-test in late September, European stocks did precisely that (Point 3 on the chart
September 22 Post: “European Equities On The Ropes”).
The subsequent bounce off of the breakout/Fibonacci/trendline support has brought the STOXX 600 almost 15% higher to where we are today. As we stated above, this is where things get difficult. If European stocks fail from here, it would place a clear lower high on the chart, the first step in establishing a downtrend. Plus, the support that held in August-September will likely be tested again. Should that happen in short order, another hold will be highly suspect. A failure to hold there would confirm a failed breakout in January and suggest a more serious downtrend is getting underway.
On the other hand, if this resistance area is able to be overtaken, there is not much stopping European stocks from visiting the April highs again. Surpassing them, however, may still prove a tall order. Let’s zoom out even further to remind you of the significance of those April peaks.
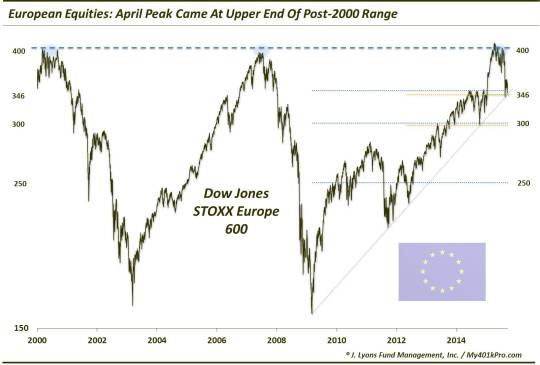
As you can see, at the April highs, prices will still be contending with a 15-year triple top in the STOXX 600 – not an easy task, but not insurmountable. The positive thing is that the April highs should have “softened up” the area a bit, so to speak. Thus, it would be more likely this time that the previous peaks could be overtaken and prices move to new all-time high territory. Should that occur, the next big up-leg in European equities would likely be underway.
First things first, however. After bouncing smartly off of support in September, the European STOXX 600 – and markets around Europe – are approaching layers of potential resistance now. The reaction at these levels should color the likely longer-term outcome laid out above.
________________
Photo of Rodney Dangerfield in the 1983 Indie comedy “Easy Money”.
More from Dana Lyons, JLFMI and My401kPro.
The commentary included in this blog is provided for informational purposes only. It does not constitute a recommendation to invest in any specific investment product or service. Proper due diligence should be performed before investing in any investment vehicle. There is a risk of loss involved in all investments.


