Resilient Global Dow Index Approaching Resistance

Thought to have fallen off the proverbial ledge, the Global Dow Index has recovered strongly – but is now approaching staunch resistance.
The last time we checked in on the Global Dow Stock Index was September 29 when we wrote that a “Key Global Equity Index Has Fallen Off The Precipice”. As the title suggests, the Global Dow had recently broken what we considered major support and all appeared hopeless at that point. But if you follow the stock market at all – or read our post from earlier that day on the Value Line Geometric Composite’s colossal test – or read yesterday’s post about the VLGC’s test on September 29 – you know that this “fall off of the precipice” did not exactly result in a “SPLAT!”. Indeed, September 29 marked the low for most stock indexes around the globe and led to the furious rally of the past 5 weeks.
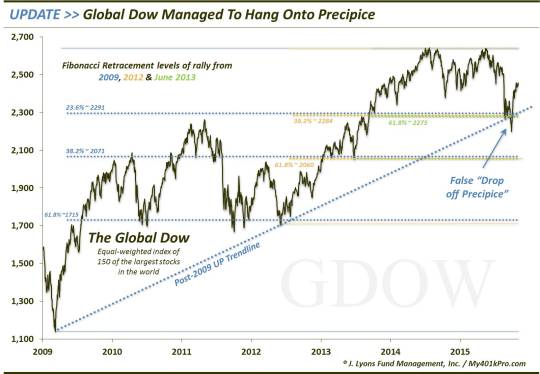
That includes the Global Dow, an equally-weighted index of the world’s 150 largest stocks. During the August stock market collapse, the Global Dow broke below some major levels of support, including the post-2009 UP trendline and these 3 significant Fibonacci Retracement lines.
- The 23.6% Fibonacci Retracement of the 2009-2015 Rally ~2291
- The 38.2% Fibonacci Retracement of the 2012-2015 Rally ~2284
- The 61.8% Fibonacci Retracement of the June 2013-2015 Rally ~2275
However, like Rasputin – or Steven Seagal – the Index proved hard to kill. It managed to regain the “precipice” and rally sharply with the rest of the global equity world.
So crisis has been averted for now. However, the Global Dow has rallied so strongly that it is now approaching the multi-layered resistance near the area of its August breakdown.
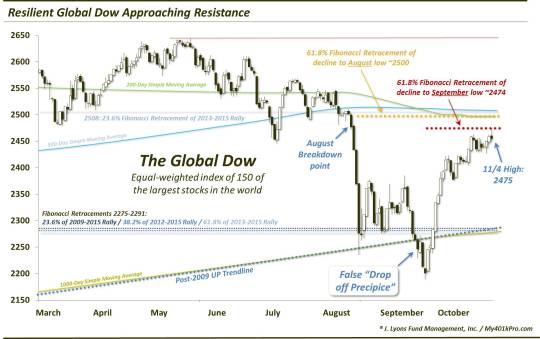
First off is the 61.8% Fibonacci Retracement of the decline from May to the September 29 low. That level sits around 2474. Yesterday’s intraday high prior to its sharp pullback was 2474.55. (By the way, if you are wondering how an index that has hardly any money trading directly off of it can conform to technical or chart analyses [and why anyone would attempt to analyze the chart in such a fashion], we don’t have an answer except…it just does. Like the Value Line Geometric Composite which we looked at in a similar post yesterday, its price conforms especially tightly to Fibonacci levels and moving averages, even though hardly anyone is actually “trading” these indexes.)
While this 2474 level may prove to be key resistance, we see much more of a challenge just above it near 2500. If we use the initial August low, which corresponds to the 3 previously mention Fibonacci Retracements that made up “the precipice”, the
61.8% Fibonacci Retracement of the decline from May would land around 2500. Other layers of potential resistance near there include:
- the mid-August breakdown point around 2501
- the 200-day moving average around 2500
- the 500-day moving average around 2510
- the 23.6% Fibonacci Retracement of the 2013-2015 Rally ~2508
- the 38.2% Fibonacci Retracement of the rally from the September 2013 breakout point to 2015 ~2507
Yes, those last 2 bullets indicate retracements of rallies, which would seem counter-intuitive since we are talking about retracements of the recent decline. However, often times, retracement levels will align with one another so closely, and prices adhere to the levels so closely, that they establish solid boundaries that prices continue to “respect”, on the way up and down.
While the Index flies under the radar a bit, because of its makeup, the Global Dow actually serves as a fairly important barometer of the state of the global large cap equity market. And while a month ago, it looked like this global equity barometer had fallen off the cliff, it miraculously was able to clutch to the key support identified. And after a sharp rally, the Index is safely off of the precipice. That said, the Global Dow faces a different challenge at the moment, in the way of formidable resistance near its August breakdown level.
Its response here will go a long way in determining whether the index will recommence its climb up the mountain of new highs – or get pushed back toward the precipice once again.
________
“Hand On Ledge” photo by William L Klender, Baltimore Sun.
More from Dana Lyons, JLFMI and My401kPro.
The commentary included in this blog is provided for informational purposes only. It does not constitute a recommendation to invest in any specific investment product or service. Proper due diligence should be performed before investing in any investment vehicle. There is a risk of loss involved in all investments.


