Broken Commodities Continue To Crush Investors

Since breaking key support 1 year ago, commodities have continued to drop, setting a 13-year low today.
This post is not one that is going to spotlight a current potential investment opportunity. In fact, it actually shines the spotlight on a development we highlighted over a year ago. And no, it is not a “told-you-so” or a back-slapper of a post. Consider it more of A) an update and B) a public service announcement.
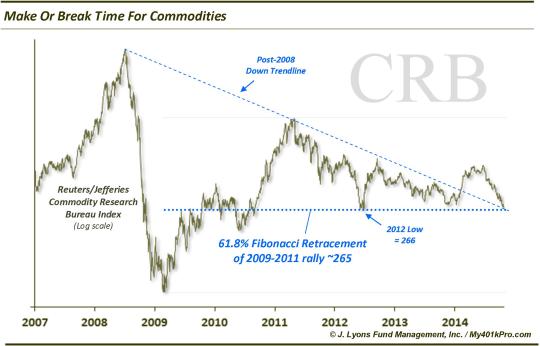
On October 30, 2014, we posted a piece entitled “It’s Make Or Break Time For Commodities”. In the post, we included a chart (as always) that detailed what we deemed to be a major area of support for the Thomson Reuters CoreCommodity CRB Index (CRB) around 266. It was so major that we suggested it was a “make or break” spot for the key commodity index. Specifically, a “make” could produce a “substantial and durable” bounce and even potentially usher in “a resumption of the post-2001 commodity bull market”. On the other hand, a “break” would “open the index up to further (perhaps significant) weakness” and maybe even “cast a doubt on the likelihood of resuming the commodity bull market any time soon.”
Here is that chart from over a year ago:
Just a few weeks later, the CRB registered a “break”, dropping below that key support level – and it has not looked back since. The break did indeed produce “further (perhaps significant) weakness” as the CRB would lose 25% of its value in just 2 months. Furthermore, the index has continued to drop for another full year which has definitively “cast a doubt on the likelihood of resuming the commodity bull market any time soon”
Here is the update as of today:
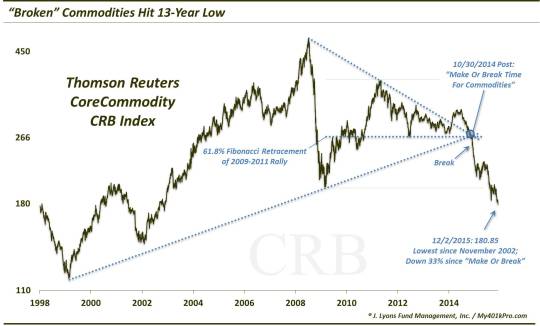
We actually expanded the chart back another 9 years to include the post-1999 UP trendline that just happened to intersect the 2 lines of support in the original chart. As you can see, the CRB closed at a new 13-year low today, around 180. The index has now lost one third of its value since violating the “make or break” level that we highlighted over a year ago.
Now, again, this post is not meant to pat ourselves on the back. In fact, it is more about identifying the point at which we would know we are wrong. If you read the post from last October, you’ll see that we actually saw ample evidence to support a bounce in the CRB from that key level. However, we also recognized that, should such a bounce not materialize and the CRB fail to hold that key level, then the index was likely broken.
While our strategy is almost always to buy “relative strength”, i.e., things that are in strong uptrends, there are times when we will take stabs at mean-reversion, knife-catching type plays. However, we will only attempt such trades at what we consider to be major, longer-term support levels. That 266 level in the CRB would have been one of those levels.
That said, in the event that that major level was broken to the downside, we knew it would be time to cut bait on the trade and move on. In our view, that is an important lesson to keep in mind. It is OK to attempt to catch a falling knife at a level you deem to be of utmost significance on the chart. If you are wrong, at least you know where to cut your losses and move on. At worst, you come away with one small knife cut.
The worst thing you can do is to continuously attempt to catch the falling knife. When something is in free-fall, realize that it is normally for a good reason. Trends tend to persist so expect that something that is plummeting to continue to plummet. Just remember that there will be just 1 bottom. In the event of a multi-year collapse in a security or commodity, etc., the odds of picking the “bottom” day out of possibly hundreds of possibilities are slim. If you repeatedly try, the odds are all you will come away with are a multitude of knife holes in your hands – and your portfolio.
Take the CRB, for example. Since breaking that key level a year ago, the index has made no less than 51 new 52-week lows. If you’ve been trying to catch the knife that whole time, your portfolio looks like swiss cheese right now. By the way, if you think that’s far-fetched because commodities sentiment was not too bad until just recently, think again. Remember that we wrote in our post last year that commodities were already despised then. They have undergone over a year of declines since then and they are still dropping.
The point is, if you are going to attempt to catch a proverbial falling knife on a chart, at least do so only at a point you deem to be a “make or break” type level. Whether or not you can likely accurately identify a “make or break” level is another matter. The point is that, should that level fail, like it did on the CRB Index a year ago, you know the security is broken and it is time to walk away.
________
Photo by Melancholy Rose.
More from Dana Lyons, JLFMI and My401kPro.
The commentary included in this blog is provided for informational purposes only. It does not constitute a recommendation to invest in any specific investment product or service. Proper due diligence should be performed before investing in any investment vehicle. There is a risk of loss involved in all investments.