December Spikes In The VIX Bring Traders Year-End Gifts

Jumps in the VIX during the month of December have (almost) always led to year-end stock market gains.
It is the time of year when research houses trot out all matters of bullish seasonal stock market patterns pertaining to year-end. It seems as though each year brings more and more attention, and giddiness, to the idea of a year-end rally (though, that is likely due to the greater reach of financial social media nowadays). Instinctively, one might be inclined to fade such bullishness given how ubiquitous and one-sided it appears to be. The problem with that is that these year-end tendencies have been very well known for many years – yet, they continue to consistently work anyway. We’ll see if these patterns continue this year.
Speaking of year-end patterns, we offer one up in this post. It is a follow-up to a study we presented in a post last December. What we looked at were spikes in the S&P Volatility Index (VIX) during the month of December and the subsequent returns in the S&P 500 into year-end. The specific parameters we used last year were spikes in the VIX of at least 34% above its 1-month low during the month of December. What we found was pretty interesting.
From the VIX inception in 1986 through 2013, there had been 52 days in December meeting that criteria. As of year-end, all 52 of the occurrences saw the S&P 500 higher. Even with the deluge of bullish year-end prognostications, that is pretty compelling stuff.
Wouldn’t you know it, though…we jinxed it. There were 10 days during last December that met the >34% criteria. And while 7 of the days resulted in a higher S&P 500 level at year-end, a large decline on the second to last day of the year brought small losses to the other 3 days, ending the signal’s flawless run. While it was likely a mere coincidence, that is how it goes in markets. Once a trend or advantage is identified, it becomes exploited until the advantage disappears.
Despite the less than perfect record, we are back with (almost) the same chart this year. On December 9, the VIX rose to 37% above its 1-month low. To fit that, we charted all the December VIX spikes of over 37% above its 1-month low since 1986. That resulted in 47 days (obviously, dates that were included in last year’s study). Prior to the final 3 signals in 2014, the first 44 of these occurrences resulted in higher prices at year-end. Furthermore, while not all gains were substantial, the average of the 44 rallies to year-end was +4.82%
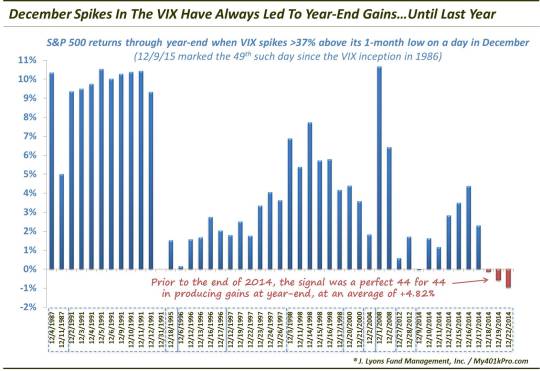
Now, as the chart shows, several years had multiple days meeting the criteria of the study. 1991 and 2014 tied for the most days with 10. Nevertheless, the sample includes instances from 11 prior years so it isn’t just a few years accounting for all of the gains.
Will the S&P 500 close 2015 above the December 9 closing price of 2047.62 and continue this signal’s stellar track record? Time will tell. As we closed last year’s post:
Of course, despite the perfect record, hopefully it goes without saying that there is no guarantee. There is always a first time for everything. However, while it may seem like everyone on Wall Street and Main Street is expecting a year-end rally, it would appear that they do have some evidence backing them up.
_____________
More from Dana Lyons, JLFMI and My401kPro.
The commentary included in this blog is provided for informational purposes only. It does not constitute a recommendation to invest in any specific investment product or service. Proper due diligence should be performed before investing in any investment vehicle. There is a risk of loss involved in all investments.

