Did Weekly Reversal Mark A Top In The Dollar?

Large weekly reversals from multi-year highs in the U.S. Dollar have led to sub-par returns – and sometimes major tops.
In the arena of “inter-market analysis”, all of the various asset classes (i.e., currencies, commodities, bonds, equities, etc.) are analyzed as to their impact on one another. This supposedly allows strategists to devise a comprehensive forecast for the movement of each asset based on certain scenarios. For what it’s worth, the problem that we have with this type of analysis is that the relationships between the various asset classes are not static. They change over time and with different cycles. However, if there was one asset that more participants would likely place as THE most impactful on the rest of the markets it would likely be the U.S. Dollar.
The Dollar has been on a tear for most of the last 18 months. However, after hitting 12-year highs intra-week, the U.S. Dollar Index (DXY) closed last week sharply lower.
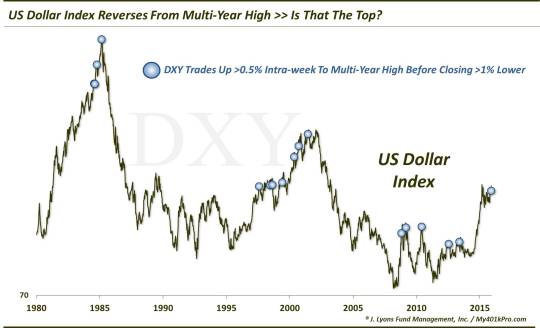
The sharp, negative reversal has participants wondering if it marked a top of some significance for the Dollar. We took a look at other statistically similar reversals to see if we could detect any potential pattern to prices following such reversals.
Specifically, we looked at instances where the DXY traded at least a half of a percent higher during the week while hitting a multi-year high before subsequently dropping over 1% to close the week lower. In our database (since 1971), we found 16 prior such instances. (The chart above begins in 1980 because there were no instances before then.)
As may be detected on the chart, while not always the case, there were a few instances when such reversals occurred near a top of some significance. Most significant were occurrences in March 1985 and June 2001 that led directly into 7-year bear markets. Several other instances led to sharp drops in the 3-6 month range.
From a quantitative standpoint, here is the collective performance of the DXY following such reversals.
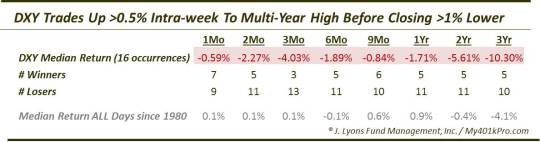
As the table illustrates, median returns were negative for the Dollar Index from 1 month out to 3 years following these reversals. Though, that isn’t in and of itself too noteworthy as the performance of the DXY over this period was essentially flat, as the median returns following ALL days indicate. However, the returns were quite a bit worse – and consistently so – over the intermediate-term of 2-3 months as well as the long-term, i.e., 2-3 years.
So is the occurrence of this reversal pattern a death knell for the Dollar? Not necessarily. From a technical perspective, looking at a longer time frame than just last week, the Dollar doesn’t “look” like a top. It rallied sharply for about 10 months into the spring after which it has traded sideways in a fairly tight range for 7 months. This is suggestive of a continuation pattern that would result in an upside resolution. On the other hand, it is possible that last week’s breakout attempt and failure marked a bearish double-top.
Putting aside the charting tea leaves, while it is possible the DXY bucks the trend, the historical results of the reversal study would lean toward challenging times ahead for the Dollar in the intermediate to longer-term. Now perhaps the weekly reversal occurrences are mere coincidence. And perhaps the subsequent weakness following them has had more to do with the fact that, at those points, the Dollar was technically extended and fundamentally due for a cyclical turn lower. Then again, maybe the occurrence of this most recent signal is telling us the same thing about the Dollar at the moment.
_______________
More from Dana Lyons, JLFMI and My401kPro.
The commentary included in this blog is provided for informational purposes only. It does not constitute a recommendation to invest in any specific investment product or service. Proper due diligence should be performed before investing in any investment vehicle. There is a risk of loss involved in all investments.